


 06:21
06:21Textbook Question
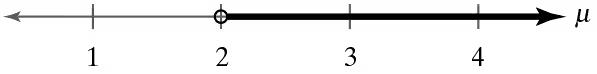
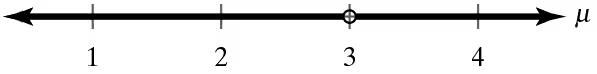
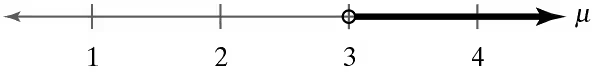
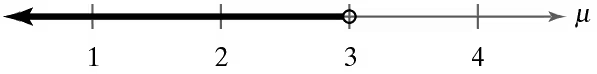
Identifying the Nature of a Hypothesis Test In Exercises 37–42, state and in words and in symbols. Then determine whether the hypothesis test is left-tailed, right-tailed, or two-tailed. Explain your reasoning. Sketch a normal sampling distribution and shade the area for the P-value.
Lung Cancer A report claims that lung cancer accounts for 25% of all cancer diagnoses.