Ch. 7 - Hypothesis Testing with One Sample
Larson - Elementary Statistics: Picturing the World 8th Edition
Larson8th EditionElementary Statistics: Picturing the WorldISBN: 9780137493470Not the one you use?Change textbook
Chapter 7, Problem 7.1.17

Graphical Analysis In Exercises 17–20, match the alternative hypothesis with its graph. Then state the null hypothesis and sketch its graph.


Ha: μ > 3


img

Verified step by step guidance
1
Step 1: Understand the alternative hypothesis (Ha: μ > 3). This indicates that the mean μ is greater than 3, so the graph should represent values of μ greater than 3 with shading or emphasis to the right of 3.
Step 2: Analyze the provided graphs. Look for the graph where the shading or emphasis starts at 3 and extends to the right, representing μ > 3. In this case, the correct graph is option 'a'.
Step 3: State the null hypothesis (H0). The null hypothesis is the opposite of the alternative hypothesis, so H0: μ ≤ 3. This means the mean μ is less than or equal to 3.
Step 4: Sketch the graph for the null hypothesis. The graph should represent values of μ less than or equal to 3, with shading or emphasis to the left of 3.
Step 5: Verify the match between the alternative hypothesis and its graph, and ensure the null hypothesis graph is correctly sketched to represent the opposite scenario.

Verified video answer for a similar problem:

This video solution was recommended by our tutors as helpful for the problem above.
Video duration:
1m
Was this helpful?

Key Concepts

Here are the essential concepts you must grasp in order to answer the question correctly.

Null Hypothesis (H0)

The null hypothesis is a statement that there is no effect or no difference, serving as a default position that indicates no change from a known value. In this case, it would state that the population mean (μ) is less than or equal to 3 (H0: μ ≤ 3). This hypothesis is tested against the alternative hypothesis to determine if there is enough evidence to reject it.
Recommended video:
Guided course
06:21
Step 1: Write Hypotheses

Alternative Hypothesis (Ha)

The alternative hypothesis represents a statement that contradicts the null hypothesis, suggesting that there is an effect or a difference. Here, Ha: μ > 3 indicates that the population mean is greater than 3. This hypothesis is what researchers aim to support through statistical testing, often leading to a one-tailed test in this context.
Recommended video:
Guided course
06:21
Step 1: Write Hypotheses

Graphical Representation of Hypotheses

Graphical representations of hypotheses help visualize the relationship between the null and alternative hypotheses. In this case, the graph would illustrate the critical region for the alternative hypothesis (Ha: μ > 3) on the right side of the number line, indicating where we would reject the null hypothesis. Understanding how to sketch these graphs is crucial for interpreting statistical results.
Recommended video:
Guided course
06:21
Step 1: Write Hypotheses
Related Practice
Textbook Question

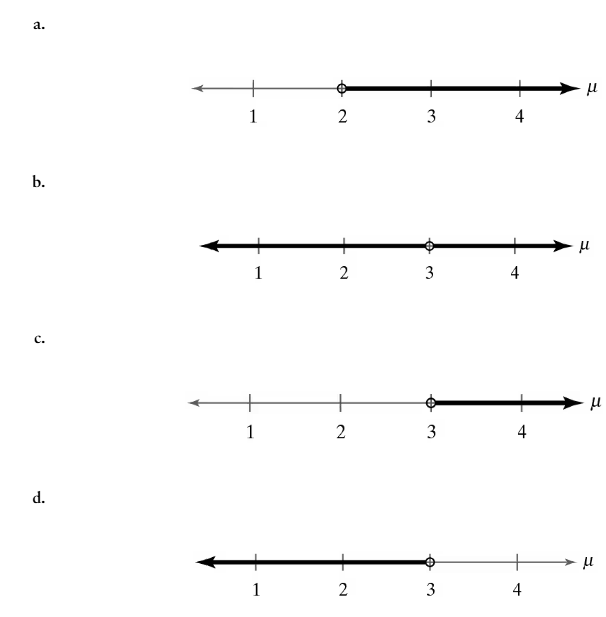
Finding Critical Values and Rejection Regions In Exercises 23–28, find the critical value(s) and rejection region(s) for the type of z-test with level of significance α. Include a graph with your answer.


Two-tailed test, α = 0.12

Textbook Question

Stating the Null and Alternative Hypotheses In Exercises 25–30, write the claim as a mathematical statement. State the null and alternative hypotheses, and identify which represents the claim.


Paying for College According to a recent survey, 54% of today’s college students used student loans to pay for college.

Textbook Question

Getting at the Concept Explain why a level of significance of α=0 is not used.

Textbook Question

True or False? In Exercises 5–10, determine whether the statement is true or false. If it is false, rewrite it as a true statement.


The level of significance is the maximum probability you allow for rejecting a null hypothesis when it is actually true.

Textbook Question

Identifying the Nature of a Hypothesis Test In Exercises 37–42, state and in words and in symbols. Then determine whether the hypothesis test is left-tailed, right-tailed, or two-tailed. Explain your reasoning. Sketch a normal sampling distribution and shade the area for the P-value.


High School Graduation Rate A high school claims that its mean graduation rate is more than 97%.

Textbook Question

Hypothesis Testing Using Rejection Regions In Exercises 19–26, (a) identify the claim and state H0 and Ha, (b) find the critical value(s) and identify the rejection region(s), (c) find the standardized test statistic t, (d) decide whether to reject or fail to reject the null hypothesis, and (e) interpret the decision in the context of the original claim. Assume the population is normally distributed.


Credit Card Debt A credit reporting agency claims that the mean credit card debt in Colorado is greater than \$5540 per borrower. You want to test this claim. You find that a random sample of 30 borrowers has a mean credit card debt of \$5594 per person and a standard deviation of \$597 per person. At , can you support the claim α=0.05?