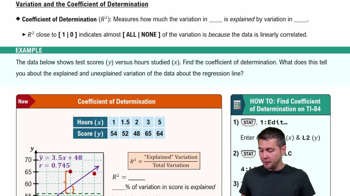
Ch. 6 - Confidence Intervals
Larson - Elementary Statistics: Picturing the World 8th Edition
Larson8th EditionElementary Statistics: Picturing the WorldISBN: 9780137493470Not the one you use?Change textbook
Chapter 6, Problem 6.1.51a

Paint Can Volumes A paint manufacturer uses a machine to fill gallon cans with paint (see figure). The manufacturer wants to estimate the mean volume of paint the machine is putting in the cans within 0.5 ounce. Assume the population of volumes is normally distributed.

a. Determine the minimum sample size required to construct a 90% confidence interval for the population mean. Assume the population standard deviation is 0.75 ounce.

Verified step by step guidance
1
Step 1: Identify the formula for determining the minimum sample size for a confidence interval. The formula is: n = (Z * σ / E)^2, where n is the sample size, Z is the z-score corresponding to the confidence level, σ is the population standard deviation, and E is the margin of error.
Step 2: Determine the z-score for a 90% confidence level. For a 90% confidence interval, the z-score is approximately 1.645. This value is derived from standard normal distribution tables.
Step 3: Substitute the given values into the formula. The population standard deviation (σ) is 0.75 ounces, and the margin of error (E) is 0.5 ounces. Plug these values into the formula: n = (1.645 * 0.75 / 0.5)^2.
Step 4: Simplify the expression inside the parentheses first. Calculate the product of the z-score and the standard deviation, then divide by the margin of error.
Step 5: Square the result from Step 4 to find the minimum sample size. Round up to the nearest whole number, as sample size must be an integer.

Verified video answer for a similar problem:

This video solution was recommended by our tutors as helpful for the problem above.
Video duration:
2m
Was this helpful?

Key Concepts

Here are the essential concepts you must grasp in order to answer the question correctly.

Confidence Interval

A confidence interval is a range of values, derived from sample statistics, that is likely to contain the population parameter with a specified level of confidence. For example, a 90% confidence interval means that if we were to take many samples and construct intervals, approximately 90% of those intervals would contain the true population mean. This concept is crucial for estimating the mean volume of paint in the cans.
Recommended video:
06:33
Introduction to Confidence Intervals

Sample Size Determination

Sample size determination involves calculating the number of observations needed to achieve a desired level of precision in estimating a population parameter. In this case, the sample size must be large enough to ensure that the margin of error (0.5 ounces) is met when estimating the mean volume of paint. The formula incorporates the population standard deviation and the desired confidence level.
Recommended video:
Guided course
06:14
Coefficient of Determination

Normal Distribution

Normal distribution is a probability distribution that is symmetric about the mean, indicating that data near the mean are more frequent in occurrence than data far from the mean. In this scenario, the assumption that the population of paint volumes is normally distributed allows for the use of specific statistical methods to calculate confidence intervals and sample sizes, making it easier to draw conclusions about the population.
Recommended video:
06:23
Using the Normal Distribution to Approximate Binomial Probabilities
Related Practice
Textbook Question

Finite Population Correction Factor In Exercises 57 and 58, use the information below.

In this section, you studied the construction of a confidence interval to estimate a population mean. In each case, the underlying assumption was that the sample size n was small in comparison to the population size N. When n ≥ 0.05N however, the formula that determines the standard error of the mean needs to be adjusted, as shown below.

[IMAGE]

Recall from the Section 5.4 exercises that the expression sqrt[(N-n)/(n-1)] is called a finite population correction factor. The margin of error is

[IMAGE]

Use the finite population correction factor to construct each confidence interval for the population mean.

a. c = 0.99, xbar = 8.6, σ = 4.9, N = 200, n = 25.

Textbook Question

Constructing Confidence Intervals In Exercises 13–24, assume the sample is from a normally distributed population and construct the indicated confidence intervals for (a) the population variance σ^2. Interpret the results.

[APPLET] Earnings The annual earnings (in thousands of dollars) of 21 randomly selected level 1 computer hardware engineers are listed. Use a 99% level of confidence. (Adapted from Salary.com)

Textbook Question

Constructing Confidence Intervals In Exercises 13–24, assume the sample is from a normally distributed population and construct the indicated confidence intervals for (a) the population variance σ^2. Interpret the results.

Volleyball The numbers of service aces scored by 15 teams randomly selected from the top 50 NCAA Division I Women’s Volleyball teams for the 2021 season have a sample standard deviation of 26.1. Use an 80% level of confidence. (Source: National Collegiate Athletic Association)

Textbook Question

Congress You wish to estimate, with 95% confidence, the population proportion of likely U.S. voters who think Congress is doing a good or excellent job. Your estimate must be accurate within 4% of the population proportion.

a. No preliminary estimate is available. Find the minimum sample size needed.

Textbook Question

Alcohol-Impaired Driving You wish to estimate, with 95% confidence, the population proportion of motor vehicle fatalities that were caused by alcohol-impaired driving. Your estimate must be accurate within 5% of the population proportion.

a. No preliminary estimate is available. Find the minimum sample size needed

Textbook Question

Soccer Balls A soccer ball manufacturer wants to estimate the mean circumference of soccer balls within 0.15 inch.

a. Determine the minimum sample size required to construct a 99% confidence interval for the population mean. Assume the population standard deviation is 0.5 inch