Textbook Question
In Exercises 21–24, construct the indicated confidence interval for the population mean μ.
c = 0.95, xbar = 31.39, σ = 0.80, n = 82.

 Verified step by step guidance
 06:33 06:33
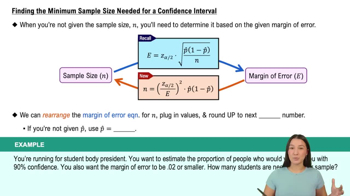 04:08
04:08In Exercises 21–24, construct the indicated confidence interval for the population mean μ.
c = 0.95, xbar = 31.39, σ = 0.80, n = 82.
In Exercises 29–32, determine the minimum sample size n needed to estimate for the values of c, σ, and E.
c = 0.95, σ = 2.5, E = 1.
In Exercises 9–12, construct the indicated confidence interval for the population mean μ using the t-distribution. Assume the population is normally distributed.
c = 0.98, xbar = 4.3, s = 0.34, n = 14
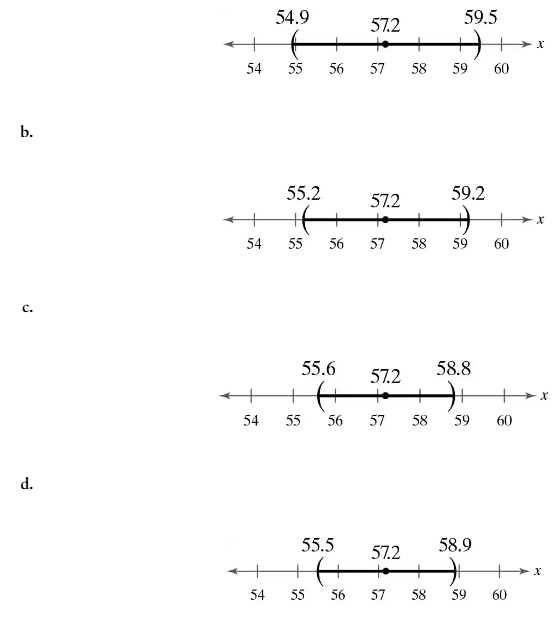
In Exercises 13 and 14, use the confidence interval to find the margin of error and the sample mean.
(14.7, 22.1)
In Exercises 29–32, determine the minimum sample size n needed to estimate for the values of c, σ, and E.
c = 0.90, σ = 6.8, E = 1.
Finding Critical Values for χ2 In Exercises 3–8, find the critical values χR2 and χL2 for the level of confidence c and sample size n.
c = 0.80, n = 51