Textbook Question
In Exercise 35, would it be unusual for the population mean to be over \$1500? Explain.

 Verified step by step guidance
 05:11 05:11
 04:48
04:48In Exercise 35, would it be unusual for the population mean to be over \$1500? Explain.
Tennis Ball Manufacturing A company manufactures tennis balls. When the balls are dropped onto a concrete surface from a height of 100 inches, the company wants the mean bounce height to be 55.5 inches. This average is maintained by periodically testing random samples of 25 tennis balls. If the t-value falls between and , then the company will be satisfied that it is manufacturing acceptable tennis balls. For a random sample, the mean bounce height of the sample is 56.0 inches and the standard deviation is 0.25 inch. Assume the bounce heights are approximately normally distributed. Is the company making acceptable tennis balls? Explain.
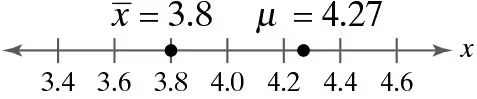
Which statistic is the best unbiased estimator for μ?
a. s
b. xbar
c. the median
d. the mode
In Exercises 9–12, construct the indicated confidence intervals for (a) the population variance and (b) the population standard deviation . Assume the sample is from a normally distributed population.
c = 0.99, s^2 = 0.64, n = 7
In Exercises 7 and 8, find the margin of error for the values of c, s, and n.
c = 0.99, s = 3, n = 6
In Exercises 5–8, find the critical value zc necessary to construct a confidence interval at the level of confidence c.
c = 0.97