


 05:11
05:11

Textbook Question
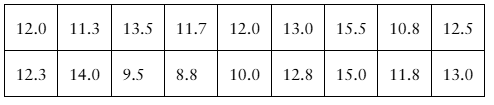
Constructing Confidence Intervals In Exercises 13–24, assume the sample is from a normally distributed population and construct the indicated confidence intervals for (a) the population variance σ^2. Interpret the results.
[APPLET] Earnings The annual earnings (in thousands of dollars) of 21 randomly selected level 1 computer hardware engineers are listed. Use a 99% level of confidence. (Adapted from Salary.com)