Textbook Question
Finding Area
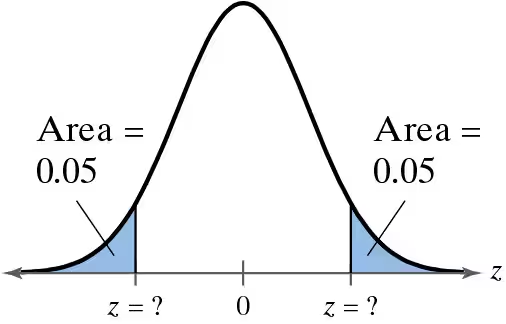
In Exercises 23–36, find the indicated area under the standard normal curve. If convenient, use technology to find the area.
To the left of z=0.33

 Verified step by step guidance
 06:31
06:31 09:47
09:47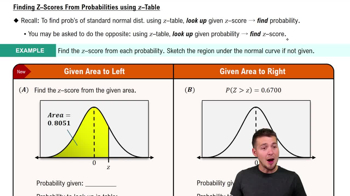 08:50
08:50Finding Area
In Exercises 23–36, find the indicated area under the standard normal curve. If convenient, use technology to find the area.
To the left of z=0.33
In Exercises 1–4, a population has a mean mu and a standard deviation sigma. Find the mean and standard deviation of the sampling distribution of sample means with sample size n.
Mu = 150, sigma =25, n = 49
Construction About 63% of the residents in a town are in favor of building a new high school. One hundred five residents are randomly selected. What is the probability that the sample proportion in favor of building a new school is less than 55%? Interpret your result.
Finding a z-Score In Exercises 1–16, use the Standard Normal Table or technology to find the z-score that corresponds to the cumulative area or percentile.
P91
True or False? In Exercises 5–8, determine whether the statement is true or false. If it is false, rewrite it as a true statement.
As the sample size increases, the mean of the distribution of sample means increases.
"Getting Physical The figure shows the results of a survey of U.S. adults ages 18 to 29 who were asked whether they participated in a sport. In the survey, 48% of the men and 23% of the women said they participate in sports. The most common sports are shown below. Use this information in Exercises 29 and 30.
You randomly select 250 U.S. men ages 18 to 29 and ask them whether they participate in at least one sport. You find that 80% say no. How likely is this result? Do you think this sample is a good one? Explain your reasoning."