Textbook Question
Finding Area
In Exercises 23–36, find the indicated area under the standard normal curve. If convenient, use technology to find the area.
Between z=0 and z=2.86

 Verified step by step guidance
 09:47
09:47 06:31
06:31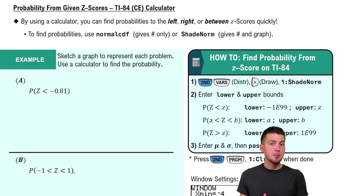 07:09
07:09Finding Area
In Exercises 23–36, find the indicated area under the standard normal curve. If convenient, use technology to find the area.
Between z=0 and z=2.86
Interpreting the Central Limit Theorem In Exercises 19–26, find the mean and standard deviation of the indicated sampling distribution of sample means. Then sketch a graph of the sampling distribution.
SAT Italian Subject Test The scores on the SAT Italian Subject Test for the 2018–2020 graduating classes are normally distributed, with a mean of 628 and a standard deviation of 110. Random samples of size 25 are drawn from this population, and the mean of each sample is determined.
Interpreting the Central Limit Theorem In Exercises 19–26, find the mean and standard deviation of the indicated sampling distribution of sample means. Then sketch a graph of the sampling distribution.
Salaries The annual salaries for web software development managers are normally distributed, with a mean of about \$136,000 and a standard deviation of about \$11,500. Random samples of 40 are drawn from this population, and the mean of each sample is determined.
Computing Probabilities for Normal Distributions In Exercises 1–6, the random variable x is normally distributed with mean mu=174 and standard deviation sigma=20. Find the indicated probability.
P(172 < x <192)
Interpreting the Central Limit Theorem In Exercises 19–26, find the mean and standard deviation of the indicated sampling distribution of sample means. Then sketch a graph of the sampling distribution.
Renewable Energy During a recent period of two years, the day-ahead prices for renewable energy in Germany (in euros per mega-watt hour) have a mean of 31.58 and a standard deviation of 12.293. Random samples of size 75 are drawn from this population, and the mean of each sample is determined.
In Exercises 9–14, write the binomial probability in words. Then, use a continuity correction to convert the binomial probability to a normal distribution probability.
P(x ≤ 150)