Ch. 4 - Discrete Probability Distributions
Larson - Elementary Statistics: Picturing the World 8th Edition
Larson8th EditionElementary Statistics: Picturing the WorldISBN: 9780137493470Not the one you use?Change textbook
Chapter 4, Problem 4.T.5a

The table shows the ages of students in a freshman orientation course.
Table displaying the ages of students and the corresponding number of students for each age from 17 to 22.
a. Construct a probability distribution.

Verified step by step guidance
1
Step 1: Understand the problem. A probability distribution lists all possible outcomes of a random variable along with their probabilities. Here, the random variable is the age of students, and the table provides the frequency of students for each age.
Step 2: Calculate the total number of students. Add up all the frequencies provided in the table: 2 (age 17) + 13 (age 18) + 4 (age 19) + 3 (age 20) + 2 (age 21) + 1 (age 22). This total will be used to calculate probabilities.
Step 3: Compute the probability for each age. Divide the frequency of students for each age by the total number of students. For example, the probability for age 17 is \( P(17) = \frac{2}{\text{Total Students}} \). Repeat this calculation for all ages.
Step 4: Construct the probability distribution table. Create a new table where each age is paired with its corresponding probability. Ensure that the sum of all probabilities equals 1, as this is a property of probability distributions.
Step 5: Verify your work. Double-check calculations to ensure accuracy and confirm that the probabilities sum to 1. This ensures the probability distribution is valid.

Verified video answer for a similar problem:

This video solution was recommended by our tutors as helpful for the problem above.
Video duration:
3m
Was this helpful?

Key Concepts

Here are the essential concepts you must grasp in order to answer the question correctly.

Probability Distribution

A probability distribution describes how the probabilities are distributed over the values of a random variable. In this context, it represents the likelihood of each age occurring among the students. To construct it, you divide the number of students at each age by the total number of students, resulting in a distribution that sums to 1.
Recommended video:
Guided course
06:39
Calculating Probabilities in a Binomial Distribution

Relative Frequency

Relative frequency is the ratio of the number of times an event occurs to the total number of trials or observations. In the case of the ages of students, it is calculated by taking the count of students for each age and dividing it by the total number of students. This provides a way to express the probability of each age in the context of the overall group.
Recommended video:
Guided course
06:38
Intro to Frequency Distributions

Cumulative Frequency

Cumulative frequency is the running total of frequencies up to a certain point in a dataset. It helps in understanding the distribution of data by showing how many observations fall below a particular value. In this scenario, it can be useful to analyze how many students are aged 18 or younger, for example, by summing the frequencies of ages 17 and 18.
Recommended video:
04:41
Creating Frequency Polygons
Related Practice
Textbook Question

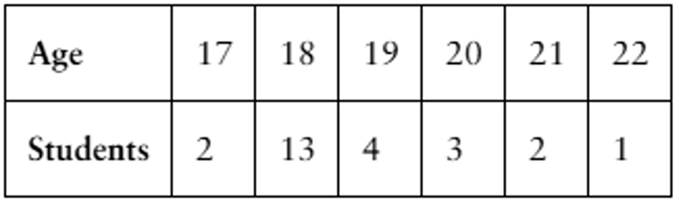
Determine whether the distribution is a probability distribution. If it is not a probability distribution, explain why.

Textbook Question

In Exercises 1–7, consider a grocery store that can process a total of four customers at its checkout counters each minute.

The mean increases to five arrivals per minute, but the store can still process only four per minute. Generate a list of 20 random numbers with a Poisson distribution for mu = 5 . Then create a table that shows the number of customers waiting at the end of 20 minutes.

Textbook Question

In Exercises 1–3, find the indicated probabilities using the geometric distribution, the Poisson distribution, or the binomial distribution. Then determine whether the events are unusual. If convenient, use a table or technology to find the probabilities.

One out of every 42 tax returns for incomes over \$1 million requires an audit. An auditor is examining tax returns for over \$1 million. Find the probability that (a) the first return requiring an audit is the 25th return the tax auditor examines, (b) the first return requiring an audit is the first or second return the tax auditor examines, and (c) none of the first five returns the tax auditor examines require an audit. (Source: Kiplinger)

1
views
Textbook Question

In Exercises 1–7, consider a grocery store that can process a total of four customers at its checkout counters each minute.

The mean number of arrivals per minute is four. Find the probability that

a. three, four, or five customers will arrive during the third minute.

1
views
Textbook Question

In Exercises 1–7, consider a grocery store that can process a total of four customers at its checkout counters each minute.

The mean number of arrivals per minute is four. Find the probability that

c. one customer is waiting in line after one minute and no customers are waiting in line after the second minute..

1
views
Textbook Question

In Exercises 1–3, find the indicated probabilities using the geometric distribution, the Poisson distribution, or the binomial distribution. Then determine whether the events are unusual. If convenient, use a table or technology to find the probabilities.

One out of every 42 tax returns for incomes over \$1 million requires an audit. An auditor is examining tax returns for over \$1 million. Find the probability that (c) none of the first five returns the tax auditor examines require an audit.

1
views