Textbook Question
Refer to the sample statistics from Exercise 5 and determine whether any of the house prices below are unusual. Explain your reasoning.
d. \$147,000

 Verified step by step guidance
 04:39
04:39 04:48
04:48 05:53
05:53Refer to the sample statistics from Exercise 5 and determine whether any of the house prices below are unusual. Explain your reasoning.
d. \$147,000
The mean annual salary for a sample of electrical engineers is \$86,500, with a standard deviation of \(1500. The data set has a bell-shaped distribution.
b. The salaries of three randomly selected electrical engineers are \)93,500, \$85,600, and \$82,750. Find the z-score that corresponds to each salary. Determine whether any of these salaries are unusual.
Tail lengths (in feet) for a sample of American alligators are listed.
6.5 3.4 4.2 7.1 5.4 6.8 7.5 3.9 4.6
a. Find the mean, median, and mode of the tail lengths. Which best describes a typical American alligator tail length? Explain your reasoning.
The data set represents the number of minutes a sample of 27 people exercise each week.
108 139 120 123 120 132 123 131 131
157 150 124 111 101 135 119 116 117
127 128 139 119 118 114 127 142 130
d. Describe the shape of the distribution as symmetric, uniform, skewed left, skewed right, or none of these.
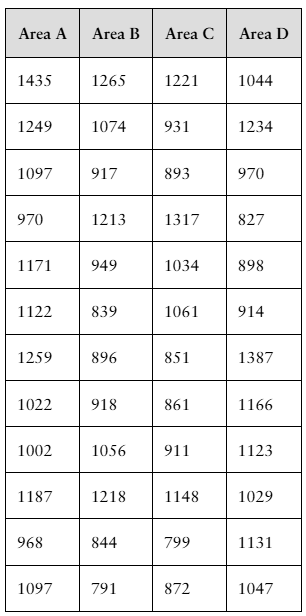
You are a member of your local apartment association. The association represents rental housing owners and managers who operate residential rental property throughout the greater metropolitan area. Recently, the association has received several complaints from tenants in a particular area of the city who feel that their monthly rental fees are much higher compared to other parts of the city.
You want to investigate the rental fees. You gather the data shown in the table at the right. Area A represents the area of the city where tenants are unhappy about their monthly rents. The data represent the monthly rents paid by a random sample of tenants in Area A and three other areas of similar size. Assume all the apartments represented are approximately the same size with the same amenities.
c. Based on your data displays, does it appear that the monthly rents in Area A are higher than the rents in the other areas of the city? Explain.
Weekly salaries (in dollars) for a sample of construction workers are listed.
1100 720 1384 1124 1255 976 718 1316
749 1062 1248 891 969 790 860 1100
a. Find the mean, median, and mode of the salaries. Which best describes a typical salary?