Textbook Question
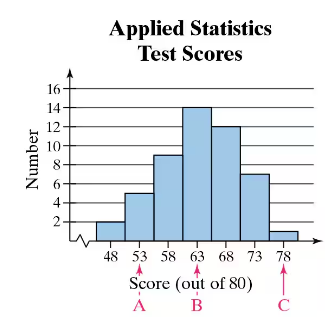
Graphical Analysis In Exercises 9–12, determine whether the approximate shape of the distribution in the histogram is symmetric, uniform, skewed left, skewed right, or none of these. Justify your answer.

 Verified step by step guidance
 06:31 06:31
 05:54
05:54Graphical Analysis In Exercises 9–12, determine whether the approximate shape of the distribution in the histogram is symmetric, uniform, skewed left, skewed right, or none of these. Justify your answer.
Putting Graphs in Context In Exercises 5–8, match the plot with the description of the sample.
a. Times (in minutes) it takes a sample of employees to drive to work
b. Grade point averages of a sample of students with finance majors
c. Top speeds (in miles per hour) of a sample of high-performance sports cars
d. Ages (in years) of a sample of residents of a retirement home
" style="" width="220">
Graphical Analysis In Exercises 9–12, determine whether the approximate shape of the distribution in the histogram is symmetric, uniform, skewed left, skewed right, or none of these. Justify your answer.
Using the Empirical Rule In Exercises 29–34, use the Empirical Rule.
The speeds for eight vehicles are listed. Using the sample statistics from Exercise 29, determine which of the data entries are unusual. Are any of the data entries very unusual? Explain your reasoning.
70, 78, 62, 71, 65, 76, 82, 64
Using and Interpreting Concepts
Finding and Discussing the Mean, Median, and Mode In Exercises 17–34, find the mean, the median, and the mode of the data, if possible. If any measure cannot be found or does not represent the center of the data, explain why.
Prices (in dollars) of Flights from Chicago to Alanta
" style="" width="235">
Using and Interpreting Concepts
Graphical Analysis In Exercises 13–16, give three observations that can be made from the graph.