Textbook Question
List the three conditions that must be met in order to use a two-sample F-test.
1
views

 Verified step by step guidance
 06:28
06:28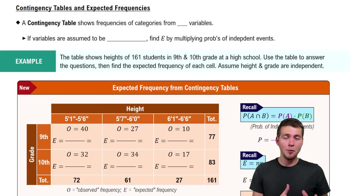 08:18
08:18 05:17
05:17List the three conditions that must be met in order to use a two-sample F-test.
Performing a Chi-Square Independence Test In Exercises 13–28, perform the indicated chi-square independence test by performing the steps below.
a. Identify the claim and state H₀ and Hₐ
b. Determine the degrees of freedom, find the critical value, and identify the rejection region.
c. Find the chi-square test statistic.
d. Decide whether to reject or fail to reject the null hypothesis.
e. Interpret the decision in the context of the original claim.
Attitudes about Safety The contingency table shows the results of a random sample of students by type of school and their attitudes on safety steps taken by the school staff. At α=0.01, can you conclude that attitudes about the safety steps taken by the school staff are related to the type of school? (Adapted from Horatio Alger Association)
Contingency Tables and Relative Frequencies In Exercises 33–36, use the information below.
The frequencies in a contingency table can be written as relative frequencies by dividing each frequency by the sample size. The contingency table below shows the number of U.S. adults (in millions) ages 25 and over by employment status and educational attainment. (Adapted from U.S. Census Bureau)
Explain why you cannot perform the chi-square independence test on these data.
Performing a Chi-Square Independence Test In Exercises 13–28, perform the indicated chi-square independence test by performing the steps below.
a. Identify the claim and state H₀ and Hₐ
b. Determine the degrees of freedom, find the critical value, and identify the rejection region.
c. Find the chi-square test statistic.
d. Decide whether to reject or fail to reject the null hypothesis.
e. Interpret the decision in the context of the original claim.
Use the contingency table and expected frequencies from Exercise 8. At α=0.05, test the hypothesis that the variables are dependent.
Finding Expected Frequencies
In Exercises 7–12, (a) calculate the marginal frequencies and (b) find the expected frequency for each cell in the contingency table. Assume that the variables are independent.
Performing a Chi-Square Independence Test In Exercises 13–28, perform the indicated chi-square independence test by performing the steps below.
a. Identify the claim and state H₀ and Hₐ
b. Determine the degrees of freedom, find the critical value, and identify the rejection region.
c. Find the chi-square test statistic.
d. Decide whether to reject or fail to reject the null hypothesis.
e. Interpret the decision in the context of the original claim.
Use the contingency table and expected frequencies from Exercise 10. At α=0.01, test the hypothesis that the variables are dependent.