Textbook Question
"In Exercises 13–16, find the critical F-value for a two-tailed test using the level of significance α and degrees of freedom d.f.N and d.f.D.
α=0.05,d.f.N=9,d.f.D=8"

 Verified step by step guidance
 06:21
06:21 06:46
06:46 05:50
05:50"In Exercises 13–16, find the critical F-value for a two-tailed test using the level of significance α and degrees of freedom d.f.N and d.f.D.
α=0.05,d.f.N=9,d.f.D=8"
In Exercises 21 and 22, (d) decide whether to reject or fail to reject the null hypothesis,
Assume the samples are random and independent, the populations are normally distributed, and the population variances are equal.
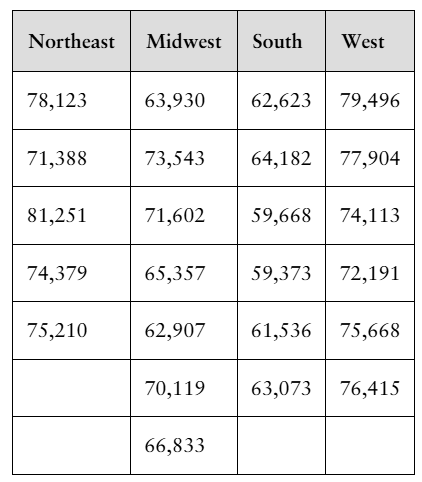
[APPLET] The table shows the monthly electric bills (in dollars) for a sample of households from four regions of the United States. At α=0.10, can you conclude that the mean monthly electric bill is different in at least one of the regions? (Adapted from U.S. Energy Information Administration)
"In Exercises 13–16, find the critical F-value for a two-tailed test using the level of significance α and degrees of freedom d.f.N and d.f.D.
α=0.10,d.f.N=15,d.f.D=27"
In Exercises 21 and 22, (e) interpret the decision in the context of the original claim. Assume the samples are random and independent, the populations are normally distributed, and the population variances are equal.
[APPLET] The table shows the monthly electric bills (in dollars) for a sample of households from four regions of the United States. At α=0.10, can you conclude that the mean monthly electric bill is different in at least one of the regions? (Adapted from U.S. Energy Information Administration)
"In Exercises 9–12, find the critical F-value for a right-tailed test using the level of significance α and degrees of freedom d.f.N and d.f.D.
α=0.05,d.f.N=6,d.f.D=50"
"In Exercises 9–12, find the critical F-value for a right-tailed test using the level of significance α and degrees of freedom d.f.N and d.f.D.
α=0.10,d.f.N=5,d.f.D=12"