Back

Stemplots (Stem-and-Leaf Plots) quiz

Control buttons has been changed to "navigation" mode.
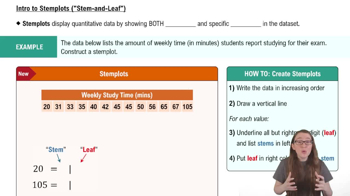
1/15
  • What is a major limitation of histograms when displaying quantitative data?

    Histograms do not show the specific values in the dataset, only the distribution of data.
  • What advantage does a stemplot have over a histogram?

    A stemplot displays both the trends and the individual data points in a dataset.
  • What is the first step in creating a stemplot from a data table?

    The first step is to arrange the data in increasing order.
  • How do you identify the stem and leaf in a number for a stemplot?

    The leaf is the rightmost digit, and the stem is all the digits to the left of the leaf.
  • In a stemplot, how many digits should the leaf contain?

    The leaf should always be one digit, regardless of the number's length.
  • What do you do after identifying stems and leaves in your dataset?

    List the stems in ascending order in the left column, only listing each stem once.
  • Should you list stems that do not appear in your dataset in a stemplot?

    No, only list stems that correspond to data points in your dataset.
  • How are leaves added to a stemplot after listing the stems?

    Add a leaf for every data point, placing it in the same row as its corresponding stem.
  • Should commas be used to separate leaves in a stemplot?

    No, leaves are listed without commas in a stemplot.
  • If two data points have the same stem and leaf, how are they represented in a stemplot?

    Each is represented by a separate leaf, so duplicate leaves are added for each data point.
  • What is the purpose of the vertical line in a stemplot?

    The vertical line separates the stems (left) from the leaves (right) in the plot.
  • Why is it important to check the number of data points when arranging them for a stemplot?

    To ensure no data points are missed or duplicated, which could affect the accuracy of the stemplot.
  • How can a stemplot help in analyzing a dataset?

    It allows you to visualize the distribution and identify trends while also seeing individual values.
  • What should you do if your data is not already in increasing order before making a stemplot?

    Locate the smallest value, write it down, and repeat until all data points are listed in order.
  • After constructing a stemplot, what can you practice to improve your understanding?

    Practice reading stemplots and identifying trends in the dataset using the plot.