Skip to main content
Statistics
My Course
Learn
Exam Prep
AI Tutor
Study Guides
Textbook Solutions
Flashcards
Explore
Try the app
My Course
Learn
Exam Prep
AI Tutor
Study Guides
Textbook Solutions
Flashcards
Explore
Try the app
Back
Quadratic Regression definitions
You can tap to flip the card.
Quadratic Regression
You can tap to flip the card.
👆
Quadratic Regression
A statistical method modeling nonlinear data with a curve, using a second-degree equation to best fit observed values.
Track progress
Control buttons has been changed to "navigation" mode.
1/15
Related flashcards
Related practice
Recommended videos
Quadratic Regression quiz #1
Quadratic Regression
10 Terms
Quadratic Regression
12. Regression
5 problems
Topic
Justin
12. Regression
6 topics
9 problems
Chapter
Justin
Guided course
07:11
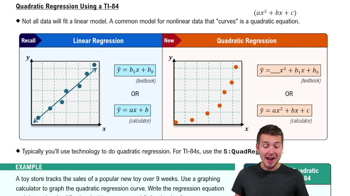
Quadratic Regression Using TI-84
2
views
Terms in this set (15)
Hide definitions
Quadratic Regression
A statistical method modeling nonlinear data with a curve, using a second-degree equation to best fit observed values.
Quadratic Equation
An expression in the form ax²+bx+c, where the squared term introduces curvature to the relationship between variables.
Coefficient of Determination
A value, often denoted as R², indicating how well a regression curve fits the data; values near 1 show strong fit.
Curvature
The characteristic of a graph that bends, distinguishing quadratic models from linear ones by their U-shaped or inverted U-shaped patterns.
TI-84 Calculator
A graphing device used to input data, perform regression analysis, and visualize equations for statistical modeling.
Stat Menu
A calculator interface section where data lists are entered and regression functions are accessed for analysis.
L1
A default list in calculators for storing independent variable data, typically used as the x-values in regression.
L2
A default list in calculators for storing dependent variable data, typically used as the y-values in regression.
Y1
A calculator variable where regression equations are stored, enabling easy graphing and visualization of fitted curves.
Window Settings
Parameters on a calculator that define the visible range for x and y axes, ensuring all relevant data points and curves are displayed.
Stat Plot
A calculator feature that enables the display of data points on a graph, facilitating comparison with regression curves.
Regression Curve
A graphical representation of the best-fit equation, showing the modeled relationship between variables in a dataset.
Data Points
Individual values in a dataset, plotted to visualize trends and assess the fit of regression models.
Predictive Analytics
The use of statistical models to forecast future outcomes based on patterns observed in historical data.
Dependent Variable
The outcome measured in regression analysis, whose values are influenced by changes in the independent variable.
 BackBack
 07:11
07:11