What is the purpose of multiple regression in statistics?
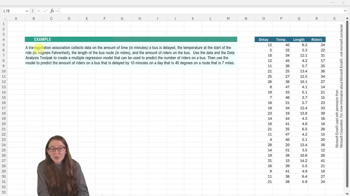
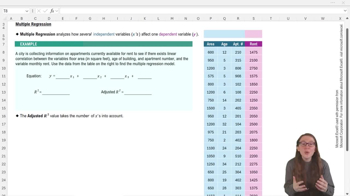
Multiple regression analyzes how several independent variables affect a single dependent variable, allowing for more complex modeling of real-world situations.
In the apartment rent example, which variable is the dependent variable (y)?
Monthly rent is the dependent variable (y) in the example.
How are independent variables labeled in multiple regression models?
Independent variables are labeled with subscripts, such as x₁, x₂, and x₃.
What Excel tool is used to perform multiple regression analysis?
The Data Analysis Toolpak add-in in Excel is used for multiple regression analysis.
What information do you need to input into Excel to run a multiple regression?
You need to input the y data (dependent variable) and all x data (independent variables), including their labels.
Where in the Excel regression output can you find the coefficients for the regression equation?
The coefficients are found in the coefficients column of the bottom table in the regression output.
What does the coefficient of determination (R²) represent in multiple regression?
R² represents the percentage of variation in the dependent variable explained by variation in at least one of the independent variables.
Why is adjusted R² used instead of R² in multiple regression?
Adjusted R² accounts for the number of independent variables in the model, penalizing unnecessary variables and providing a better measure of model quality.
What happens to adjusted R² when you add an irrelevant variable to the model?
Adjusted R² decreases if an irrelevant variable is added, indicating a worse model fit.
How can you determine if an independent variable is relevant to the model?
A relevant variable has a clear, logical, and predictive relationship with the dependent variable, often confirmed by correlation or common sense.
What is 'double dipping' in the context of multiple regression variables?
Double dipping occurs when two independent variables provide overlapping information, which should be avoided to prevent redundancy.
How do you compare two multiple regression models to determine which is better?
Compare their adjusted R² values; the model with the higher adjusted R² is considered better.
What is the typical relationship between adjusted R² and R² values?
Adjusted R² is always less than or equal to R² and usually slightly lower.
What does a small increase in adjusted R² indicate when removing an irrelevant variable?
A small increase in adjusted R² means the model is improved, even if the gain is minor, by excluding irrelevant variables.
What should you do if you are unsure about the relevance of an independent variable?
Check for a logical or predictive relationship, or plot the variable against the dependent variable to visually assess correlation.
 Back
Back
 06:37
06:37