Skip to main content
Statistics
My Course
Learn
Exam Prep
AI Tutor
Study Guides
Textbook Solutions
Flashcards
Explore
Try the app
My Course
Learn
Exam Prep
AI Tutor
Study Guides
Textbook Solutions
Flashcards
Explore
Try the app
Back
Linear Regression & Least Squares Method definitions
You can tap to flip the card.
Scatter Plot
You can tap to flip the card.
👆
Scatter Plot
Graphical display showing the relationship between two variables using plotted points on x and y axes.
Track progress
Control buttons has been changed to "navigation" mode.
1/15
Related flashcards
Related practice
Recommended videos
Linear Regression & Least Squares Method quiz #1
Linear Regression & Least Squares Method
24 Terms
Linear Regression & Least Squares Method
12. Regression
3 problems
Topic
Residuals
12. Regression
4 problems
Topic
12. Regression
6 topics
9 problems
Chapter
Justin
Guided course
04:57
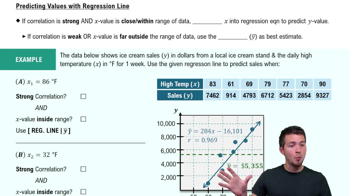
Using Regression Lines to Predict Values
3
views
Guided course
05:02
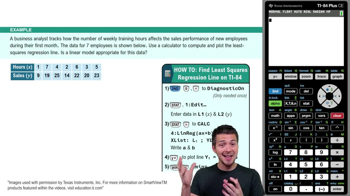
Intro to Least Squares Regression Example 1
5
views
Guided course
07:01
Intro to Least Squares Regression
3
views
Terms in this set (15)
Hide definitions
Scatter Plot
Graphical display showing the relationship between two variables using plotted points on x and y axes.
Correlation
Measure indicating the strength and direction of a relationship between two variables in a dataset.
Linear Regression
Statistical technique modeling the relationship between two variables with a straight line equation.
Least Squares Method
Procedure for finding the line that minimizes the sum of squared vertical distances from data points.
Residual
Vertical distance between a data point and the predicted value on the regression line.
Best Fit Line
Line that most closely represents the trend in the data, minimizing the sum of squared residuals.
Regression Equation
Formula, typically y=ax+b, used to predict values based on the linear relationship between variables.
Slope
Rate of change in the regression equation, indicating how much y changes for each unit increase in x.
Y-Intercept
Value where the regression line crosses the y-axis, representing predicted y when x is zero.
Extrapolation
Prediction for values outside the observed data range, often less reliable than within-range estimates.
Mean
Average value of a dataset, used as the best estimate when predictions fall outside the data range.
Linear Correlation Coefficient
Numerical value, often r, quantifying the strength and direction of linear association between variables.
Stat Plot
Calculator feature enabling visualization of data points for analysis of patterns and trends.
Diagnostic On
Calculator setting that activates statistical diagnostics, including correlation coefficients.
Y Hat
Symbol representing predicted values from the regression equation, distinguishing them from actual data.
 BackBack
 04:57
04:57