Skip to main content
Statistics
My Course
Learn
Exam Prep
AI Tutor
Study Guides
Textbook Solutions
Flashcards
Explore
Try the app
My Course
Learn
Exam Prep
AI Tutor
Study Guides
Textbook Solutions
Flashcards
Explore
Try the app
Back
Correlation Coefficient definitions
You can tap to flip the card.
Correlation Coefficient
You can tap to flip the card.
👆
Correlation Coefficient
A numerical value between -1 and 1 that quantifies the relationship's direction and strength between two variables.
Track progress
Control buttons has been changed to "navigation" mode.
1/15
Related flashcards
Related practice
Recommended videos
Correlation Coefficient quiz #1
Correlation Coefficient
39 Terms
Correlation Coefficient quiz #2
Correlation Coefficient
40 Terms
Correlation Coefficient quiz #3
Correlation Coefficient
40 Terms
Correlation Coefficient
11. Correlation
3 problems
Topic
Zachary
11. Correlation
2 topics
4 problems
Chapter
Zachary
Guided course
05:43
Correlation Coefficient
4
views
Guided course
04:40
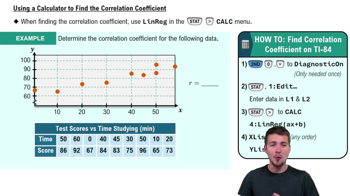
Calculating Correlation Coefficient - Graphing Calculator
5
views
Guided course
03:44
Calculating Correlation Coefficient - Graphing Calculator Example 1
2
views
Terms in this set (15)
Hide definitions
Correlation Coefficient
A numerical value between -1 and 1 that quantifies the relationship's direction and strength between two variables.
Linear Correlation Coefficient
A specific measure, denoted by r, that assesses how closely data points cluster around a straight trend line.
Direction
Indicates whether the relationship between variables trends upward (positive) or downward (negative) based on the sign of r.
Strength
Reflects how tightly data points cluster around a trend line; values near ±1 show strong relationships, values near 0 show weak ones.
Positive Correlation
A relationship where increases in one variable are associated with increases in another, represented by positive r values.
Negative Correlation
A relationship where increases in one variable are associated with decreases in another, represented by negative r values.
Scatterplot
A graphical display of paired data points used to visually assess trends and relationships between two variables.
Trend Line
A straight line drawn through data points on a scatterplot to indicate the general direction of the relationship.
No Correlation
A situation where data points are widely scattered, and r is close to zero, indicating no discernible relationship.
TI-84
A graphing calculator commonly used to input data and compute statistical measures such as the correlation coefficient.
Stat Menu
A calculator feature that allows access to statistical functions, including data entry and calculation of regression statistics.
LinReg
A calculator function for linear regression analysis, providing values like r and r squared from input data.
Diagnostic On
A calculator setting that enables display of statistical values, including r, during regression calculations.
R Squared
A value shown in regression output that represents the proportion of variance explained, distinct from r but related.
Best Fit Line
A line that most closely represents the overall trend in a scatterplot, used to assess correlation visually.
 BackBack

 05:43
05:43