Skip to main content
Statistics
My Course
Learn
Exam Prep
AI Tutor
Study Guides
Textbook Solutions
Flashcards
Explore
Try the app
My Course
Learn
Exam Prep
AI Tutor
Study Guides
Textbook Solutions
Flashcards
Explore
Try the app
Back
Confidence Intervals for Population Proportion definitions
You can tap to flip the card.
Confidence Interval
You can tap to flip the card.
👆
Confidence Interval
A range of values calculated from sample data that likely contains the true population proportion with a specified level of confidence.
Track progress
Control buttons has been changed to "navigation" mode.
1/15
Related flashcards
Related practice
Recommended videos
Confidence Intervals for Population Proportion quiz #1
Confidence Intervals for Population Proportion
10 Terms
Confidence Intervals for Population Proportion
8. Sampling Distributions & Confidence Intervals: Proportion
7 problems
Topic
Ernest
8. Sampling Distributions & Confidence Intervals: Proportion
4 topics
11 problems
Chapter
Ernest
06:38
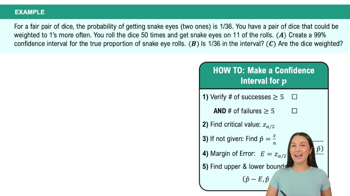
Constructing Confidence Intervals for Proportions Example 1
3
views
04:08
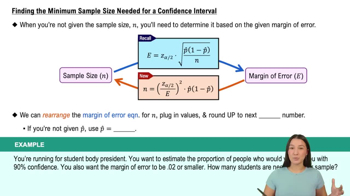
Finding the Minimum Sample Size Needed for a Confidence Interval
3
views
04:24
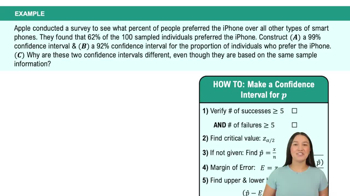
Constructing Confidence Intervals for Proportions Example 2
2
views
Terms in this set (15)
Hide definitions
Confidence Interval
A range of values calculated from sample data that likely contains the true population proportion with a specified level of confidence.
Population Proportion
The true fraction of individuals in a population exhibiting a particular characteristic, often denoted as p.
Point Estimate
A single value, calculated from sample data, used as the best guess for the population proportion.
Sample Size
The total number of individuals or observations included in a sample, represented by n.
Margin of Error
The maximum expected difference between the point estimate and the true population proportion, based on sample data.
Critical Z-Value
A number from the standard normal distribution that corresponds to the desired confidence level, used in interval calculations.
Confidence Level
The probability, expressed as a percentage, that the confidence interval contains the true population proportion.
Sampling Distribution
The probability distribution of a statistic, such as p̂, calculated from repeated samples of the same size.
Successes
The count of individuals in a sample exhibiting the characteristic of interest, used to compute p̂.
Failures
The count of individuals in a sample not exhibiting the characteristic of interest, used to verify normality.
Normality Condition
A requirement that both np and nq are at least 5, ensuring the sampling distribution of p̂ is approximately normal.
Lower Bound
The smallest value in a confidence interval, calculated by subtracting the margin of error from the point estimate.
Upper Bound
The largest value in a confidence interval, calculated by adding the margin of error to the point estimate.
One-Prop C Interval
A calculator function on the TI-84 used to quickly compute confidence intervals for population proportions.
Alpha
The probability that the confidence interval does not contain the true population proportion, equal to 1 minus the confidence level.
 BackBack
 06:38
06:38