Skip to main content
Statistics
My Course
Learn
Exam Prep
AI Tutor
Study Guides
Textbook Solutions
Flashcards
Explore
Try the app
My Course
Learn
Exam Prep
AI Tutor
Study Guides
Textbook Solutions
Flashcards
Explore
Try the app
Back
Goodness of Fit Test definitions
You can tap to flip the card.
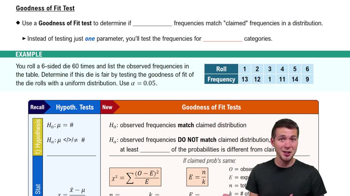
Goodness of Fit Test
You can tap to flip the card.
👆
Goodness of Fit Test
Statistical procedure comparing observed frequencies to expected frequencies to assess conformity with a claimed distribution.
Track progress
Control buttons has been changed to "navigation" mode.
1/15
Related flashcards
Related practice
Recommended videos
Goodness of Fit Test quiz #1
Goodness of Fit Test
20 Terms
Chi Square Goodness of Fit Test
13. Chi-Square Tests & Goodness of Fit
4 problems
Topic
Justin
13. Chi-Square Tests & Goodness of Fit
4 topics
5 problems
Chapter
Guided course
05:24
Goodness of Fit Test: Unequal Probabilities
Guided course
08:49
Goodness of Fit Test Example 1
Guided course
10:17
Goodness of Fit Test
Terms in this set (15)
Hide definitions
Goodness of Fit Test
Statistical procedure comparing observed frequencies to expected frequencies to assess conformity with a claimed distribution.
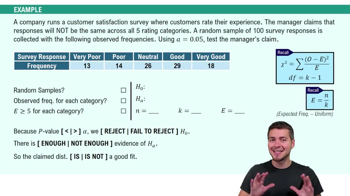
Observed Frequency
Count of occurrences recorded in each category from collected data, representing actual outcomes.
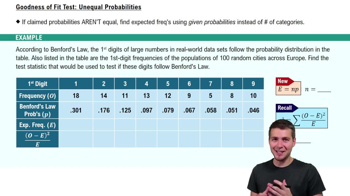
Expected Frequency
Theoretical count calculated for each category based on a claimed probability distribution and sample size.
Null Hypothesis
Assumption that observed frequencies align with those predicted by the claimed distribution.
Alternative Hypothesis
Statement suggesting at least one observed frequency differs from the expected frequency under the claimed distribution.
Chi-Squared Statistic
Sum quantifying the squared differences between observed and expected frequencies, normalized by expected values.
Uniform Distribution
Probability model where all categories have equal likelihood, leading to equal expected frequencies.
Significance Level
Threshold probability, often denoted as alpha, used to determine whether to reject the null hypothesis.
P Value
Probability of obtaining a test statistic as extreme as the observed one, assuming the null hypothesis is true.
Degrees of Freedom
Value calculated as the number of categories minus one, used in determining the chi-squared distribution.
Critical Value
Cutoff point from the chi-squared distribution used to decide whether the test statistic is significant.
Benford's Law
Distribution describing the frequency of digits in real-world datasets, with lower digits appearing more often.
Sample Size
Total number of data points or trials included in the analysis, affecting expected frequencies.
Category
Distinct group or outcome within a dataset, each with its own observed and expected frequency.
Discrepancy
Difference between observed and expected frequencies, influencing the magnitude of the test statistic.
 BackBack
 05:24
05:24