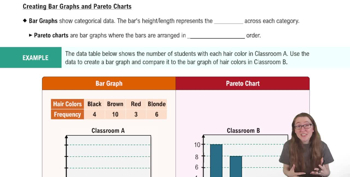
Back

Bar Graphs and Pareto Charts definitions

Control buttons has been changed to "navigation" mode.
1/15
  • Bar Graph

    A visual tool for displaying frequencies of categories using bars, with heights or lengths representing the count for each category.
  • Categorical Data

    Information grouped by distinct categories, often qualitative, such as hair color or classroom type.
  • Frequency

    The count of occurrences for a specific category within a dataset, often shown by the height of a bar.
  • X-Axis

    The horizontal line in a graph where categories are typically placed for bar graphs.
  • Y-Axis

    The vertical line in a graph used to represent the scale and frequencies of categories.
  • Scale

    A set of values on the y-axis that determines how frequencies are visually represented in a bar graph.
  • Tick Mark

    A small line or indicator on an axis that helps denote specific values or intervals for the scale.
  • Pareto Chart

    A special bar graph with bars arranged in descending order, making it easier to identify the most common categories.
  • Descending Order

    An arrangement where values or bars are sorted from largest to smallest, enhancing readability in charts.
  • Data Visualization

    The process of representing data visually to reveal patterns, trends, and insights for analysis.
  • Qualitative Data

    Non-numeric information categorized by attributes or qualities, such as colors or names.
  • Comparison

    The act of evaluating differences or similarities between datasets, often using visual tools like bar graphs.
  • Table

    A structured arrangement of data, often used as a source for creating bar graphs.
  • Trend

    A general direction or pattern observed in data, often highlighted through visual representation.
  • Business Analytics

    The application of statistical and data visualization techniques to inform business decisions and strategies.