- Download the worksheet to save time writing
- Start solving the practice problems
- If you're stuck, watch the video solutions
- See your summary to get more insights

A retail analyst recorded service times (minutes) for customers at two checkout configurations: an express lane (for up to items) and a standard lane (no item limit). From simple random samples, the times are:
Express lane times:
Standard lane times:
i. Construct separate confidence intervals for the population standard deviation in each lane.
ii. Based on these intervals, does the express lane appear to have less variability than the standard lane?
iii. Do both samples satisfy the requirements for constructing these intervals?
Find the critical values and for a confidence level of with sample size .
A study records the monthly water consumption (in liters) of households in a neighborhood. A small sample contains the values , , , . Ten bootstrap samples are generated from this data:
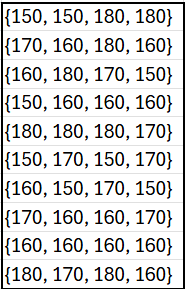
Using the same bootstrap samples, construct an confidence interval estimate of the standard deviation of the monthly water consumption.
A quality control team collects a random sample of batteries and finds that the sample variance in battery life is hours2. Assume the data are from a normally distributed population. Construct the confidence interval for the population variance and the population standard deviation.
A psychologist measures reaction times (in seconds) for a simple cognitive task in a sample of participants. The sample standard deviation of reaction times is s. Assuming reaction times are (approximately) normally distributed, construct a confidence interval (up to two decimal places) for the true population standard deviation .