Join thousands of students who trust us to help them ace their exams!
Multiple Choice
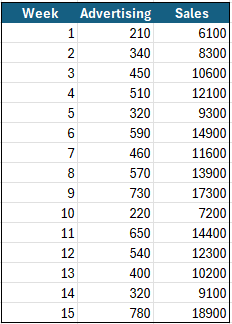
A small business tracks how advertising spending relates to weekly sales. Are the actual sales numbers for weeks with \$400 ad-spending within the interval?
A
Yes
B
No
C
More info is required.
0 Comments
Verified step by step guidance
1
Step 1: Understand the problem context. We have data on weekly advertising spending and corresponding sales for 15 weeks. The question asks if the actual sales for weeks with \$400 advertising spending fall within a certain prediction interval (D).
Step 2: Identify the weeks with \$400 advertising spending. From the table, week 13 has advertising spending of \$400 with sales of 10200.
Step 3: To determine if the actual sales fall within the interval, we need to calculate the prediction interval for sales when advertising spending is \$400. This involves fitting a linear regression model with advertising as the independent variable and sales as the dependent variable.
Step 4: Use the regression equation \(\hat{y} = b_0 + b_1 x\) to predict sales at \(x=400\). Then calculate the prediction interval using the formula:
\(\hat{y} \pm t_{\alpha/2, n-2} \cdot s_e \cdot \sqrt{1 + \frac{1}{n} + \frac{(x - \bar{x})^2}{\sum (x_i - \bar{x})^2}}\)
where \(s_e\) is the standard error of estimate, \(t\) is the critical t-value, \(n\) is the number of data points, and \(\bar{x}\) is the mean advertising spending.
Step 5: Compare the actual sales value (10200) to the calculated prediction interval. If 10200 lies within the interval, the answer is 'Yes'; otherwise, 'No'. If the interval cannot be calculated with the given data, then 'More info is required'.


 Verified step by step guidance
