Ch. 9 - Inferences from Two Samples
Triola - Elementary Statistics 14th Edition
Triola14th EditionElementary StatisticsISBN: 9780137366446Not the one you use?Change textbook
Chapter 9, Problem 9.2.18a

In Exercises 5–20, assume that the two samples are independent simple random samples selected from normally distributed populations, and do not assume that the population standard deviations are equal. (Note: Answers in Appendix D include technology answers based on Formula 9-1 along with “Table” answers based on Table A-3 with df equal to the smaller of n1-1 and n2-1)


Queues Listed on the next page are waiting times (seconds) of observed cars at a Delaware inspection station. The data from two waiting lines are real observations, and the data from the single waiting line are modeled from those real observations. These data are from Data Set 30 “Queues” in Appendix B. The data were collected by the author.


a. Use a 0.01 significance level to test the claim that cars in two queues have a mean waiting time equal to that of cars in a single queue.


Verified step by step guidance
1
Step 1: State the null hypothesis (H₀) and the alternative hypothesis (H₁). The null hypothesis is H₀: μ₁ = μ₂ = μ₃, which means the mean waiting times for cars in two queues and a single queue are equal. The alternative hypothesis is H₁: At least one mean waiting time is different.
Step 2: Identify the significance level (α). The problem specifies a significance level of 0.01, which will be used to determine whether to reject the null hypothesis.
Step 3: Calculate the sample means and sample standard deviations for each group (Two Lines and One Line). Use the provided data to compute these values. For each group, calculate the mean using the formula: μ = x n , and the standard deviation using the formula: s = ( x - μ ) 2 ( n - 1 ) .
Step 4: Perform a one-way ANOVA test to compare the means of the three groups. Use the formula for the F-statistic: F = MS between MS within , where MS_between is the mean square between groups and MS_within is the mean square within groups.
Step 5: Compare the calculated F-statistic to the critical value from the F-distribution table at α = 0.01 with the appropriate degrees of freedom. If the F-statistic exceeds the critical value, reject the null hypothesis; otherwise, fail to reject the null hypothesis.

Verified video answer for a similar problem:

This video solution was recommended by our tutors as helpful for the problem above.
Video duration:
9m
Was this helpful?

Key Concepts

Here are the essential concepts you must grasp in order to answer the question correctly.

Independent Samples

Independent samples refer to two or more groups of data that are collected separately and do not influence each other. In this context, the waiting times from two queues are treated as independent samples, meaning the observations from one queue do not affect the observations from the other. This is crucial for applying statistical tests that assume independence, such as the t-test for comparing means.
Recommended video:
Guided course
06:28
Independence Test

Hypothesis Testing

Hypothesis testing is a statistical method used to determine whether there is enough evidence to reject a null hypothesis in favor of an alternative hypothesis. In this scenario, the null hypothesis states that the mean waiting times of cars in the two queues are equal to that of cars in a single queue. The significance level of 0.01 indicates the threshold for determining whether the observed data is statistically significant.
Recommended video:
Guided course
06:21
Step 1: Write Hypotheses

Significance Level

The significance level, often denoted as alpha (α), is the probability of rejecting the null hypothesis when it is actually true. In this case, a significance level of 0.01 means there is a 1% risk of concluding that there is a difference in mean waiting times when there is none. This level is chosen to minimize the likelihood of Type I errors, which occur when a true null hypothesis is incorrectly rejected.
Recommended video:
03:33
Finding Binomial Probabilities Using TI-84 Example 1
Related Practice
Textbook Question

In Exercises 5–20, assume that the two samples are independent simple random samples selected from normally distributed populations, and do not assume that the population standard deviations are equal. (Note: Answers in Appendix D include technology answers based on Formula 9-1 along with “Table” answers based on Table A-3 with df equal to the smaller of n1-1 and n2-1)


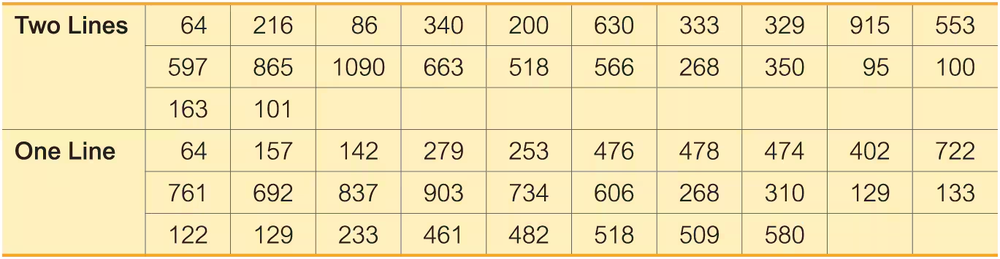
Bicycle Commuting A researcher used two different bicycles to commute to work. One bicycle was steel and weighed 30.0 lb; the other was carbon and weighed 20.9 lb. The commuting times (minutes) were recorded with the results shown below (based on data from “Bicycle Weights and Commuting Time,” by Jeremy Groves, British Medical Journal).


a. Use a 0.05 significance level to test the claim that the mean commuting time with the heavier bicycle is the same as the mean commuting time with the lighter bicycle.


Textbook Question

Second-Hand Smoke Samples from Data Set 15 “Passive and Active Smoke” include cotinine levels measured in a group of smokers ( n = 40, x_bar = 172.48 ng/mL, 119.50 ng/mL ) and a group of nonsmokers not exposed to tobacco smoke ( n = 40, x_bar = 16.35 ng/mL, 62.53 ng/mL ). Cotinine is a metabolite of nicotine, meaning that when nicotine is absorbed by the body, cotinine is produced.


a. Use a 0.05 significance level to test the claim that the variation of cotinine in smokers is greater than the variation of cotinine in nonsmokers not exposed to tobacco smoke.

1
views
Textbook Question

Cigarette Pack Warnings A study was conducted to find the effects of cigarette pack warnings that consisted of text or pictures. Among 1078 smokers given cigarette packs with text warnings, 366 tried to quit smoking. Among 1071 smokers given cigarette packs with warning pictures, 428 tried to quit smoking. (Results are based on data from “Effect of Pictorial Cigarette Pack Warnings on Changes in Smoking Behavior,” by Brewer et al., Journal of the American Medical Association.) Use a 0.01 significance level to test the claim that the proportion of smokers who tried to quit in the text warning group is less than the proportion in the picture warning group.


a. Test the claim using a hypothesis test.


Textbook Question

Can Dogs Detect Malaria? A study was conducted to determine whether dogs could detect malaria from socks worn by malaria patients and socks worn by patients without malaria. Among 175 socks worn by malaria patients, the dogs made correct identifications 123 times. Among 145 socks worn by patients without malaria, the dogs made correct identifications 131 times (based on data presented at an annual meeting of the American Society of Tropical Medicine, by principal investigator Steve Lindsay). Use a 0.05 significance level to test the claim of no difference between the two rates of correct responses.


a. Test the claim using a hypothesis test.

Textbook Question

In Exercises 5–16, use the listed paired sample data, and assume that the samples are simple random samples and that the differences have a distribution that is approximately normal.


Measured and Reported Weights Listed below are measured and reported weights (lb) of random female subjects (from Data Set 4 “Measured and Reported” in Appendix B).


a. Use a 0.05 significance level to test the claim that for females, the measured weights tend to be higher than the reported weights.


Textbook Question

Confidence Interval Assume that we want to use the sample data in Exercise 1 for constructing a confidence interval to be used for testing the given claim.


a. What is the confidence level that should be used for the confidence interval?