Skip to main content
Precalculus
My Course
Learn
Exam Prep
AI Tutor
Study Guides
Flashcards
Explore
Try the app
My Course
Learn
Exam Prep
AI Tutor
Study Guides
Flashcards
Explore
Try the app
Back
Graphing Systems of Inequalities quiz
You can tap to flip the card.
What is the first step when graphing a two-dimensional inequality?
You can tap to flip the card.
👆
What is the first step when graphing a two-dimensional inequality?
The first step is to graph the corresponding line or curve by replacing the inequality symbol with an equal sign.
Track progress
Control buttons has been changed to "navigation" mode.
1/15
Related flashcards
Related practice
Recommended videos
Graphing Systems of Inequalities definitions
Graphing Systems of Inequalities
15 Terms
Graphing Systems of Inequalities
18. Systems of Equations and Matrices
6 problems
Topic
Determinants and Cramer's Rule
18. Systems of Equations and Matrices
6 problems
Topic
18. Systems of Equations and Matrices
4 topics
10 problems
Chapter
Guided course
6:19
Systems of Inequalities
2
views
Guided course
3:55
Example 1
1
views
Guided course
4:37
Example 2
2
views
Terms in this set (15)
Hide definitions
What is the first step when graphing a two-dimensional inequality?
The first step is to graph the corresponding line or curve by replacing the inequality symbol with an equal sign.
How do you decide whether to use a solid or dashed line when graphing an inequality?
Use a solid line for 'greater than or equal to' or 'less than or equal to' and a dashed line for 'greater than' or 'less than'.
What is the purpose of testing a point when graphing an inequality?
Testing a point helps determine which side of the line or curve should be shaded to represent the solution set.
If a test point satisfies the inequality, which region do you shade?
You shade the region that includes the test point if it makes the inequality true.
What shortcut can you use if the inequality is in the form y > mx + b?
If y is greater than (or greater than or equal to) the expression, shade above the line; if less than, shade below.
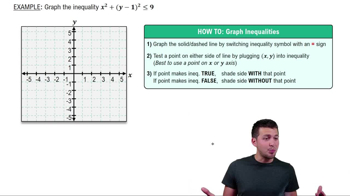
How do you graph a nonlinear inequality like y ≥ x² - 1?
Graph the curve y = x² - 1 as a solid parabola, then test a point to determine which side to shade, usually above or inside the parabola.
What does the solution to a system of inequalities represent on the graph?
It represents the region where the shaded areas of all inequalities overlap.
How do you graph a system of inequalities with both linear and nonlinear equations?
Graph each line or curve individually, shade the appropriate regions, and identify the area where all shadings overlap.
What happens if the shaded regions of a system of inequalities do not overlap?
If there is no overlap, the system has no solution.
When graphing y < x, what type of line do you use and which region do you shade?
Use a dashed line for y = x and shade below the line.
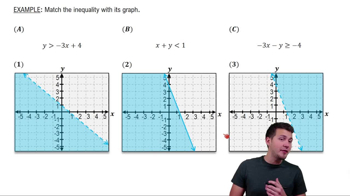
How do you graph the inequality x ≥ 1 on a two-dimensional graph?
Draw a solid vertical line at x = 1 and shade the region to the right of the line.
What is the significance of the vertex when graphing a quadratic inequality?
The vertex helps locate the position and orientation of the parabola, which is essential for accurate shading.
How do you test if a point (x, y) satisfies an inequality?
Substitute the x and y values into the inequality and check if the resulting statement is true.
What is the general process for graphing any inequality, linear or nonlinear?
Graph the boundary (line or curve), test a point, and shade the region that satisfies the inequality.
In a system of inequalities, how do you indicate the solution region on your graph?
Shade the region where all individual shaded areas overlap, as this region satisfies all inequalities in the system.
 BackBack
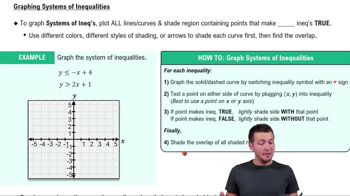
 6:19
6:19