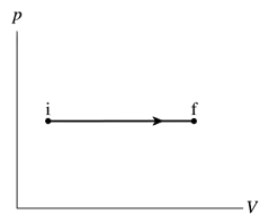
Ch 19: Work, Heat, and the First Law of Thermodynamics
Knight Calc - Physics for Scientists and Engineers 5th Edition
Knight Calc5th EditionPhysics for Scientists and EngineersISBN: 9780137344796Not the one you use?Change textbook
Chapter 19, Problem 7

Draw a first-law bar chart (see Figure 19.12) for the gas process in FIGURE EX19.7.

Verified step by step guidance
1
Step 1: Analyze the given graph. The graph shows a pressure-volume (P-V) diagram where the process is an isobaric expansion. The pressure remains constant while the volume increases from an initial state (i) to a final state (f).
Step 2: Recall the first law of thermodynamics, which states: ΔU = Q - W, where ΔU is the change in internal energy, Q is the heat added to the system, and W is the work done by the system. For an isobaric process, work done (W) is given by W = PΔV, where ΔV is the change in volume.
Step 3: In an isobaric expansion, heat (Q) is added to the system to increase the volume, and part of this heat is used to do work (W) while the rest contributes to the change in internal energy (ΔU). The first-law bar chart will represent these three quantities: Q, W, and ΔU.
Step 4: To draw the bar chart, represent Q as a positive bar since heat is added to the system. Represent W as a positive bar since work is done by the system during expansion. Represent ΔU as a positive or negative bar depending on whether the internal energy increases or decreases (this depends on the specific gas and conditions).
Step 5: Label the bars clearly in the chart. Ensure the height of the Q bar equals the sum of the heights of the W and ΔU bars, as per the first law of thermodynamics (ΔU = Q - W). This visual representation helps to understand the energy transfer during the process.

Verified video answer for a similar problem:

This video solution was recommended by our tutors as helpful for the problem above.
Was this helpful?

Key Concepts

Here are the essential concepts you must grasp in order to answer the question correctly.

First Law of Thermodynamics

The First Law of Thermodynamics states that energy cannot be created or destroyed, only transformed from one form to another. In the context of thermodynamic processes, this principle implies that the change in internal energy of a system is equal to the heat added to the system minus the work done by the system. This law is fundamental for analyzing energy exchanges in gas processes.
Recommended video:
Guided course
08:04
The First Law of Thermodynamics

Pressure-Volume (p-V) Diagram

A Pressure-Volume (p-V) diagram is a graphical representation of the relationship between the pressure and volume of a gas during a thermodynamic process. Each point on the graph represents a state of the gas, and the area under the curve can represent work done by or on the gas. Understanding this diagram is crucial for visualizing how gases behave under different conditions.
Recommended video:
Guided course
08:07
Work and PV Diagrams

Work Done by a Gas

The work done by a gas during expansion or compression can be calculated using the formula W = ∫PdV, where P is the pressure and dV is the change in volume. In a p-V diagram, this work corresponds to the area under the curve of the process. Recognizing how to calculate and interpret this work is essential for applying the First Law of Thermodynamics to gas processes.
Recommended video:
Guided course
03:47
Calculating Work Done on Monoatomic Gas