Back

Speed Distribution of Ideal Gases quiz

Control buttons has been changed to "navigation" mode.
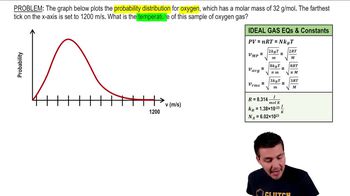
1/15
  • What is the Maxwell-Boltzmann distribution in the context of ideal gases?

    It is a curve that shows the number of gas particles versus their speeds, illustrating the probability of finding particles at various speeds in an ideal gas.
  • How is the most probable speed (V_MP) identified on a Maxwell-Boltzmann distribution curve?

    It is the speed corresponding to the peak (highest point) of the distribution curve.
  • What is the formula for the most probable speed (V_MP) of an ideal gas?

    V_MP = sqrt(2RT/M), where R is the gas constant, T is temperature, and M is molar mass.
  • How does the formula for RMS speed (V_RMS) differ from that of the most probable speed?

    The RMS speed formula uses a 3 under the square root (V_RMS = sqrt(3RT/M)), while the most probable speed uses a 2 (V_MP = sqrt(2RT/M)).
  • What is the formula for the average speed (V_avg) of an ideal gas?

    V_avg = sqrt((8RT)/(πM)), where R is the gas constant, T is temperature, and M is molar mass.
  • How does the average speed (V_avg) compare to the most probable and RMS speeds?

    The average speed is greater than the most probable speed but less than the RMS speed.
  • Why is the RMS speed typically higher than the average speed?

    Because RMS speed is calculated using the squares of the speeds, which skews the value toward higher numbers.
  • What are the calculated values of V_MP, V_avg, and V_RMS for a gas at 300 K with M = 0.028 kg/mol?

    V_MP = 422 m/s, V_avg = 476.3 m/s, and V_RMS = 516 m/s.
  • What happens to the most probable speed when the temperature increases from 300 K to 600 K?

    The most probable speed increases, for example, from 422 m/s at 300 K to 596 m/s at 600 K.
  • How does increasing temperature affect the Maxwell-Boltzmann speed distribution curve?

    The curve flattens and widens, indicating a greater spread of possible speeds and higher average speeds.
  • Which of the three speeds (V_MP, V_avg, V_RMS) is the least for a given temperature?

    The most probable speed (V_MP) is the least among the three.
  • What does the area under the Maxwell-Boltzmann distribution curve represent?

    It represents the total number of particles in the gas sample.
  • If you want to find the speed you are most likely to measure in a gas, which speed do you use?

    You use the most probable speed (V_MP).
  • What is the effect of increasing temperature on all three characteristic speeds (V_MP, V_avg, V_RMS)?

    All three speeds increase as temperature increases.
  • Why do gas particles in a container not all travel at the same speed?

    Because they are constantly colliding, speeding up, and slowing down, resulting in a distribution of speeds.