Textbook Question
Ball bearings are made by letting spherical drops of molten metal fall inside a tall tower—called a shot tower—and solidify as they fall. What is the bearing's impact velocity?
1
views

 Verified step by step guidance
 03:04
03:04 08:07
08:07 08:35
08:35Ball bearings are made by letting spherical drops of molten metal fall inside a tall tower—called a shot tower—and solidify as they fall. What is the bearing's impact velocity?
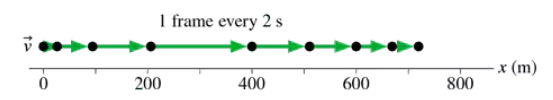
Write a short description of the motion of a real object for which FIGURE EX1.20 would be a realistic position-versus-time graph.
A speed skater moving to the left across frictionless ice at 8.0 m/s hits a 5.0-m-wide patch of rough ice. She slows steadily, then continues on at 6.0 m/s. What is her acceleration on the rough ice?
A Porsche challenges a Honda to a 400 m race. Because the Porsche's acceleration of 3.5 m/s2 is larger than the Honda's 3.0 m/s2, the Honda gets a 1.0 s head start. Who wins? By how many seconds?
Ball bearings are made by letting spherical drops of molten metal fall inside a tall tower—called a shot tower—and solidify as they fall. If a bearing needs 4.0 s to solidify enough for impact, how high must the tower be?
When you sneeze, the air in your lungs accelerates from rest to 150 km/h in approximately 0.50 s. What is the magnitude of the acceleration of the air in m/s2?