Skip to main content
Microeconomics
My Course
Learn
Exam Prep
AI Tutor
Study Guides
Flashcards
Explore
Try the app
My Course
Learn
Exam Prep
AI Tutor
Study Guides
Flashcards
Explore
Try the app
Back
Total Revenue Along a Linear Demand Curve definitions
You can tap to flip the card.
Elasticity
You can tap to flip the card.
👆
Elasticity
Ratio of percentage changes between two variables, indicating responsiveness of one variable to changes in another.
Track progress
Control buttons has been changed to "navigation" mode.
1/14
Related flashcards
Related practice
Recommended videos
Total Revenue Along a Linear Demand Curve quiz #1
Total Revenue Along a Linear Demand Curve
10 Terms
Total Revenue Along a Linear Demand Curve
4. Elasticity
10 problems
Topic
Income Elasticity of Demand
4. Elasticity
10 problems
Topic
4. Elasticity
11 topics
15 problems
Chapter
Guided course
07:13
Total Revenue Along a Linear Demand Curve
9
views
Terms in this set (14)
Hide definitions
Elasticity
Ratio of percentage changes between two variables, indicating responsiveness of one variable to changes in another.
Slope
Ratio of unit changes between two variables, measured in specific units, not percentages.
Linear Demand Curve
Graphical representation connecting price and quantity axes with a straight line, showing constant unit changes.
Elastic Demand
Section of a demand curve where percentage change in quantity exceeds percentage change in price.
Inelastic Demand
Section of a demand curve where percentage change in price exceeds percentage change in quantity.
Unit Elasticity
Point on a demand curve where percentage change in price equals percentage change in quantity.
Total Revenue
Product of price and quantity, showing how much money is generated at each point along the demand curve.
Price Axis
Vertical axis on a graph representing different price levels for a good or service.
Quantity Axis
Horizontal axis on a graph representing different quantities demanded for a good or service.
Revenue Maximization
Point on a demand curve where total revenue reaches its highest value.
Percentage Change
Relative change between two values, expressed as a proportion of the original value.
Middle Point
Central location on a linear demand curve where unit elasticity and maximum revenue occur.
Graphical Representation
Visual display of relationships between variables, such as price, quantity, and total revenue.
Demand Schedule
Table listing prices and corresponding quantities demanded, used to plot the demand curve.
 BackBack
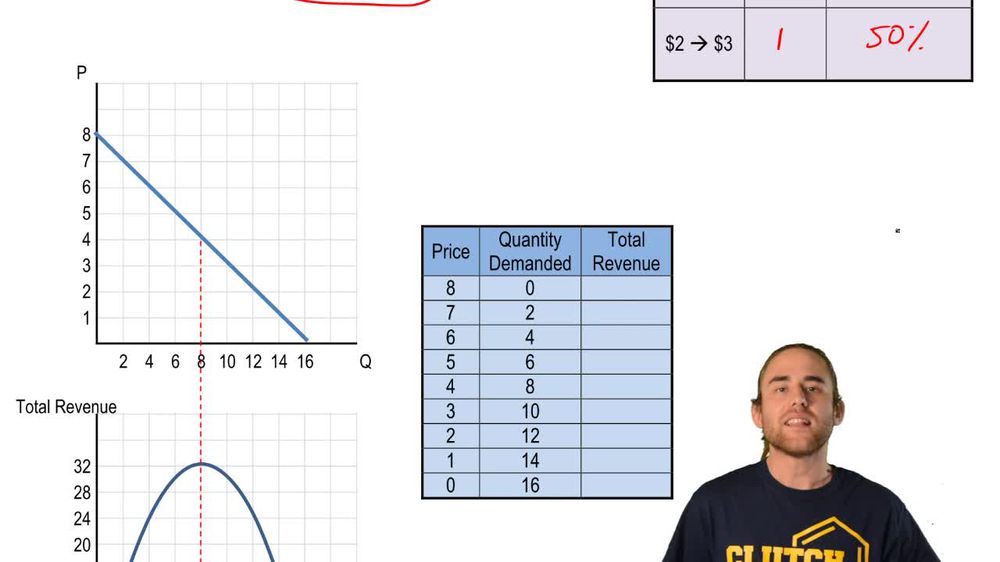
 07:13
07:13