Skip to main content
Microeconomics
My Course
Learn
Exam Prep
AI Tutor
Study Guides
Flashcards
Explore
Try the app
My Course
Learn
Exam Prep
AI Tutor
Study Guides
Flashcards
Explore
Try the app
Back
The Relationship Between Average Cost and Marginal Cost definitions
You can tap to flip the card.
Average Cost
You can tap to flip the card.
👆
Average Cost
Calculated by dividing total cost by output; changes direction based on whether marginal cost is above or below its value.
Track progress
Control buttons has been changed to "navigation" mode.
1/15
Related flashcards
Related practice
Recommended videos
The Relationship Between Average Cost and Marginal Cost quiz
The Relationship Between Average Cost and Marginal Cost
15 Terms
The Relationship Between Average Cost and Marginal Cost
10. The Costs of Production
10 problems
Topic
Graphing Costs
10. The Costs of Production
10 problems
Topic
10. The Costs of Production
9 topics
15 problems
Chapter
Guided course
06:38
Average Cost and Marginal Cost
2
views
Guided course
08:56
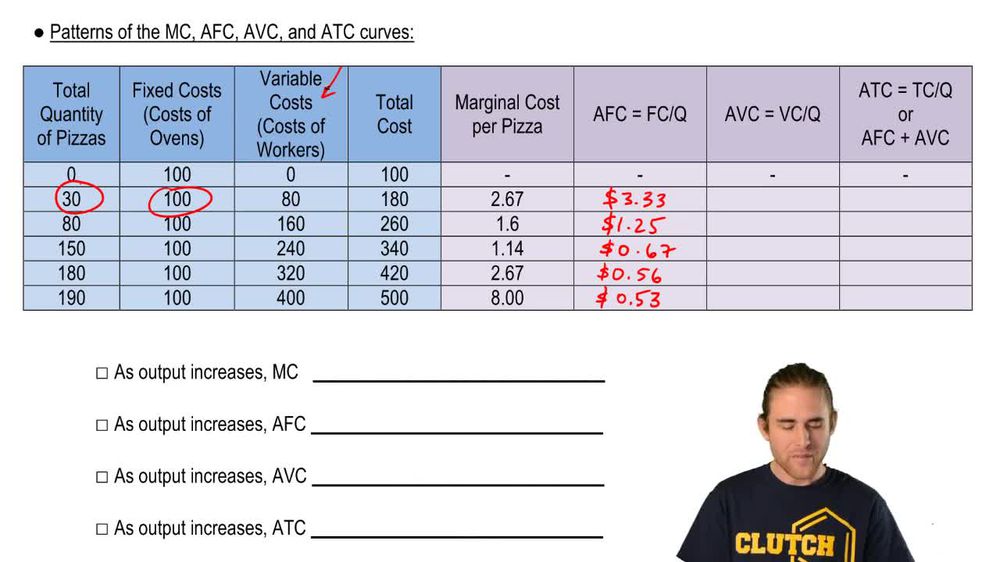
Patterns of MC, AFC, AVC, and ATC curves
4
views
Terms in this set (15)
Hide definitions
Average Cost
Calculated by dividing total cost by output; changes direction based on whether marginal cost is above or below its value.
Marginal Cost
Represents the expense of producing one additional unit; determines if average cost rises or falls.
Fixed Cost
Remains unchanged regardless of production level; its impact per unit diminishes as output increases.
Variable Cost
Increases with output; influences average variable cost and total cost calculations.
Average Fixed Cost
Obtained by dividing fixed cost by output; consistently decreases as production expands.
Average Variable Cost
Found by dividing variable cost by output; exhibits a U-shaped pattern as output changes.
Average Total Cost
Sum of average fixed cost and average variable cost; can also be calculated as total cost divided by output.
Output
Quantity of goods produced; affects the calculation and behavior of all average cost measures.
Total Cost
Sum of fixed and variable costs for all units produced; used to determine average total cost.
U-Shape
Describes the pattern where average variable cost and average total cost decrease then increase as output rises.
Driving Force
Refers to marginal cost's role in determining whether average cost moves up or down.
Quantity
Number of units produced; serves as the denominator in average cost calculations.
Cumulative GPA
Used as an analogy for average cost; reflects the overall average after multiple periods.
Semester GPA
Used as an analogy for marginal cost; shows the effect of a single period on the overall average.
Graph
Visual representation of cost curves; helps distinguish the unique behavior of average fixed cost from other averages.
 BackBack
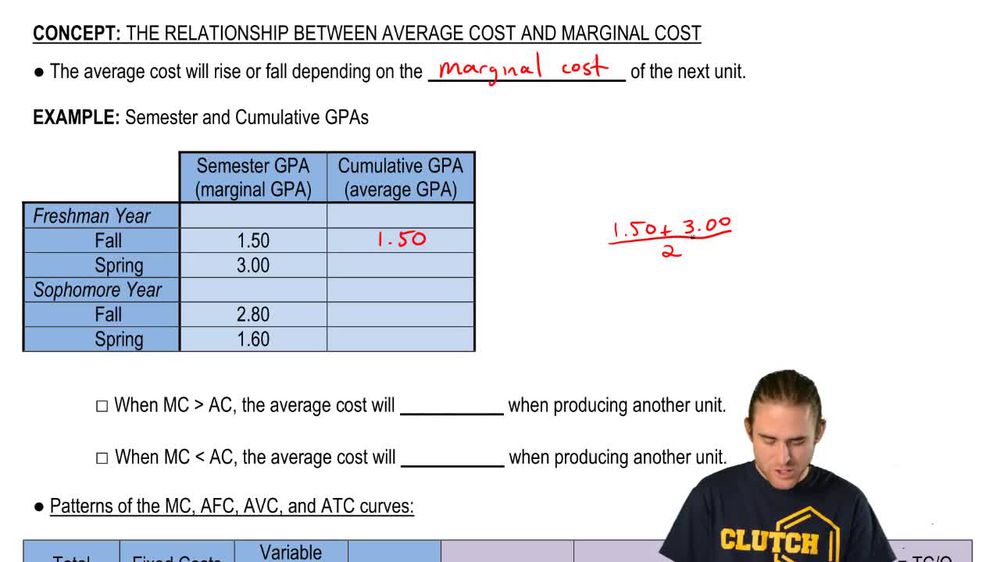
 06:38
06:38