Skip to main content
Microeconomics
My Course
Learn
Exam Prep
AI Tutor
Study Guides
Flashcards
Explore
Try the app
My Course
Learn
Exam Prep
AI Tutor
Study Guides
Flashcards
Explore
Try the app
Back
The Laffer Curve definitions
You can tap to flip the card.
Laffer Curve
You can tap to flip the card.
👆
Laffer Curve
A parabolic graph showing how tax revenue rises with tax rates up to a peak, then falls as rates continue to increase.
Track progress
Control buttons has been changed to "navigation" mode.
1/15
Related flashcards
Related practice
Recommended videos
The Laffer Curve quiz #1
The Laffer Curve
10 Terms
The Laffer Curve
6. Introduction to Taxes and Subsidies
10 problems
Topic
Quantitative Analysis of Taxes
6. Introduction to Taxes and Subsidies
9 problems
Topic
6. Introduction to Taxes and Subsidies
8 topics
12 problems
Chapter
Guided course
09:01
Laffer Curve
3
views
Terms in this set (15)
Hide definitions
Laffer Curve
A parabolic graph showing how tax revenue rises with tax rates up to a peak, then falls as rates continue to increase.
Tax Rate
The percentage or amount levied on each unit exchanged, affecting both price and quantity in a market.
Tax Revenue
The total funds collected by the government, calculated as the tax amount multiplied by the quantity exchanged.
Quantity Exchanged
The number of units traded in a market, which decreases as taxes increase, impacting overall tax revenue.
Demand Curve
A downward-sloping line representing buyers' willingness to pay at various prices, shifted by taxes.
Supply Curve
An upward-sloping line showing sellers' willingness to provide goods at different prices, altered by taxes.
Equilibrium
The point where supply and demand intersect, disrupted by the imposition of taxes.
Per Unit Tax
A fixed amount charged for each item exchanged, influencing both price and quantity.
Optimal Tax
The tax size that maximizes government revenue without excessively reducing the quantity exchanged.
Downward Slope
The portion of the Laffer Curve where increasing tax rates leads to declining tax revenue.
Tax Box
The area between buyer and seller prices on a graph, representing government revenue from taxation.
Arthur Laffer
The economist who conceptualized the relationship between tax rates and tax revenue, giving the curve its name.
Medium-Sized Tax
A tax level that balances rate and quantity exchanged, resulting in the highest possible tax revenue.
Large Tax
A high tax rate that significantly reduces the quantity exchanged, often causing tax revenue to fall.
Small Tax
A low tax rate yielding minimal government revenue due to limited funds collected per unit.
 BackBack
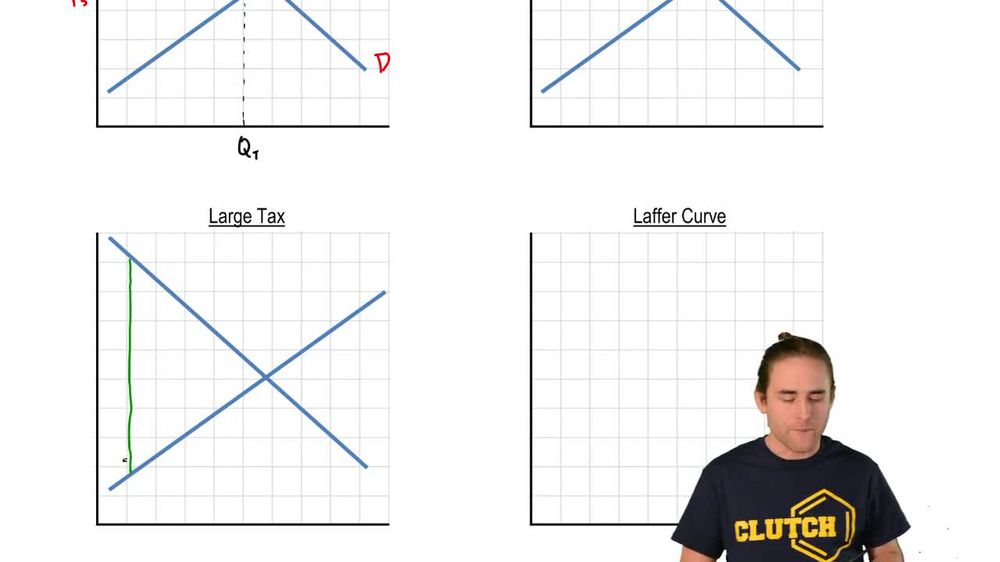
 09:01
09:01