Skip to main content
Microeconomics
My Course
Learn
Exam Prep
AI Tutor
Study Guides
Flashcards
Explore
Try the app
My Course
Learn
Exam Prep
AI Tutor
Study Guides
Flashcards
Explore
Try the app
Back
The Consumption Function definitions
You can tap to flip the card.
Consumption Function
You can tap to flip the card.
👆
Consumption Function
Graphical or mathematical representation showing how household spending changes with disposable income.
Track progress
Control buttons has been changed to "navigation" mode.
1/13
Related flashcards
Recommended videos
The Consumption Function quiz
The Consumption Function
15 Terms
Guided course
02:45
1 = MPC + MPS
Guided course
04:20
Marginal Propensity to Consume and Save
Guided course
02:49
Equation of the Consumption Function
Terms in this set (13)
Hide definitions
Consumption Function
Graphical or mathematical representation showing how household spending changes with disposable income.
Disposable Income
Money available to households after taxes, used for either spending or saving.
Autonomous Consumption
Spending that occurs even when disposable income is zero, covering basic needs like food and shelter.
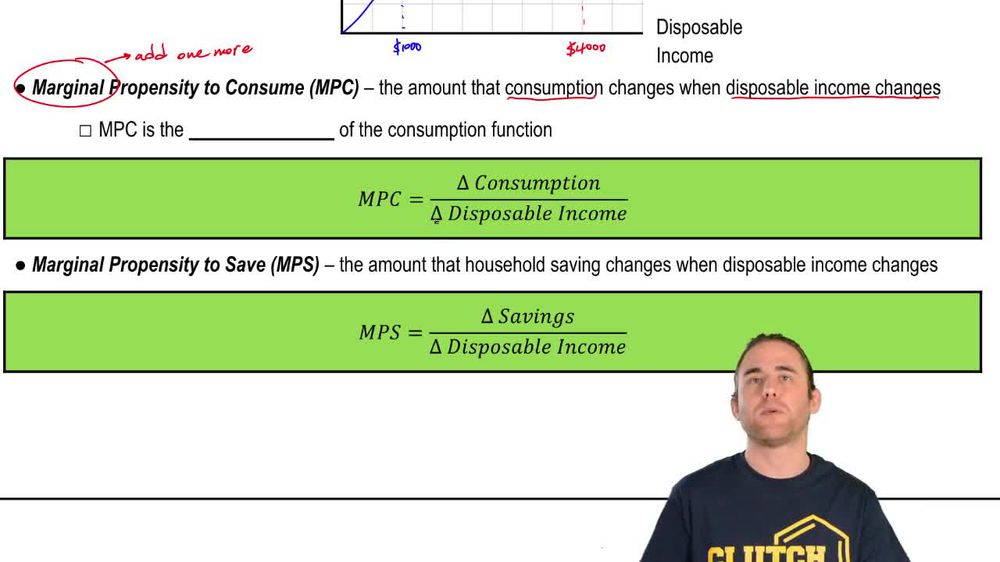
Marginal Propensity to Consume
Fraction of each additional dollar of disposable income that is spent rather than saved.
Marginal Propensity to Save
Portion of each extra dollar of disposable income that is not spent but set aside.
45 Degree Line
Reference line on a graph where every dollar of disposable income is used for consumption.
Savings
Amount of disposable income not spent, represented by the gap between the consumption function and the 45 degree line.
Dis Savings
Situation where spending exceeds disposable income, often requiring use of savings or incurring debt.
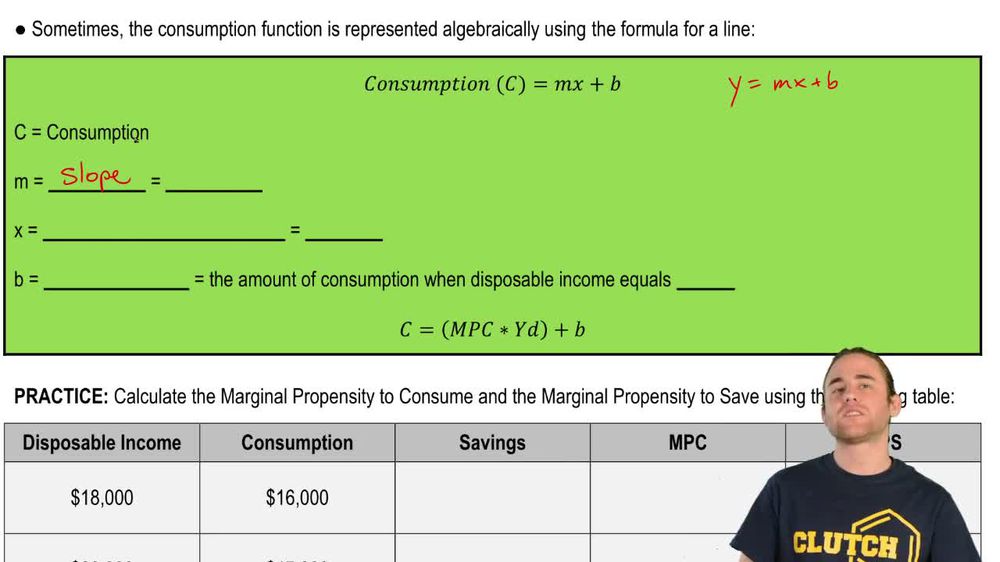
Slope
Rate at which consumption increases as disposable income rises, equal to the marginal propensity to consume.
Y-Intercept
Value on the consumption function graph indicating spending when disposable income is zero.
Consumption Schedule
Alternative term for the consumption function, often used to describe household spending patterns.
Equation of a Line
Mathematical expression used to model the consumption function, typically in the form C = MPC × YD + b.
National Income
Total earnings in an economy, from which taxes are subtracted to determine disposable income.
 BackBack
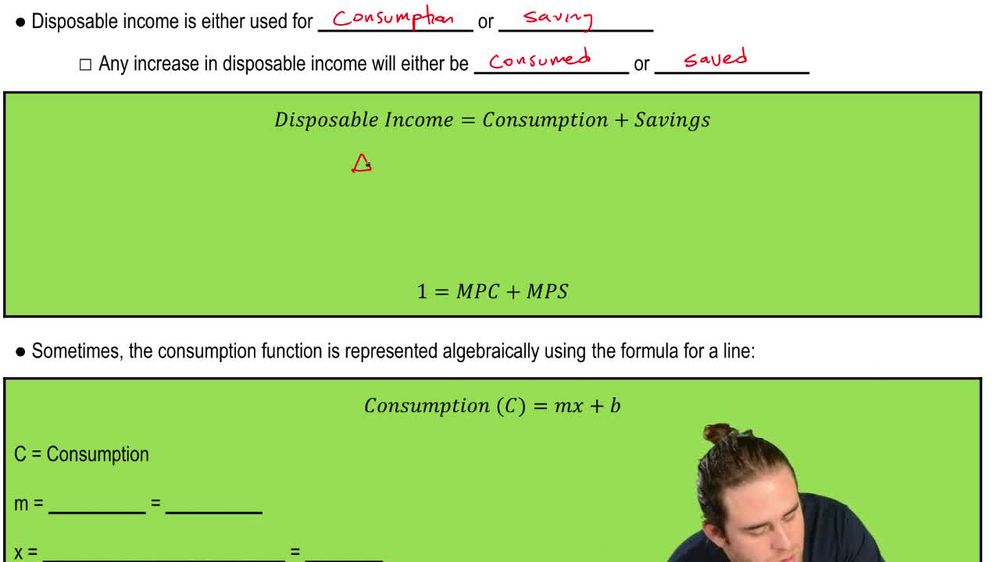
 02:45
02:45