Back

The Supply Curve quiz #1

Control buttons has been changed to "navigation" mode.
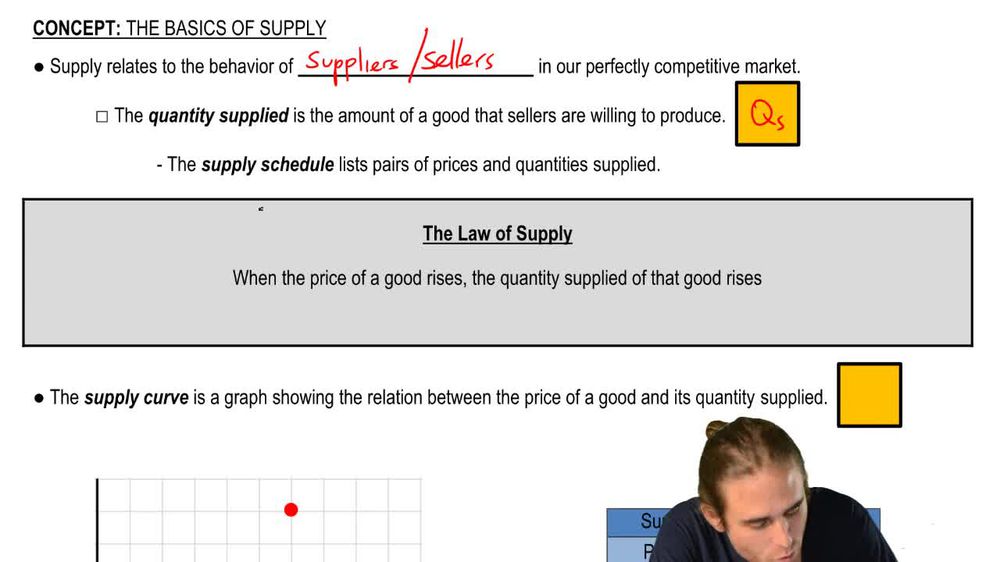
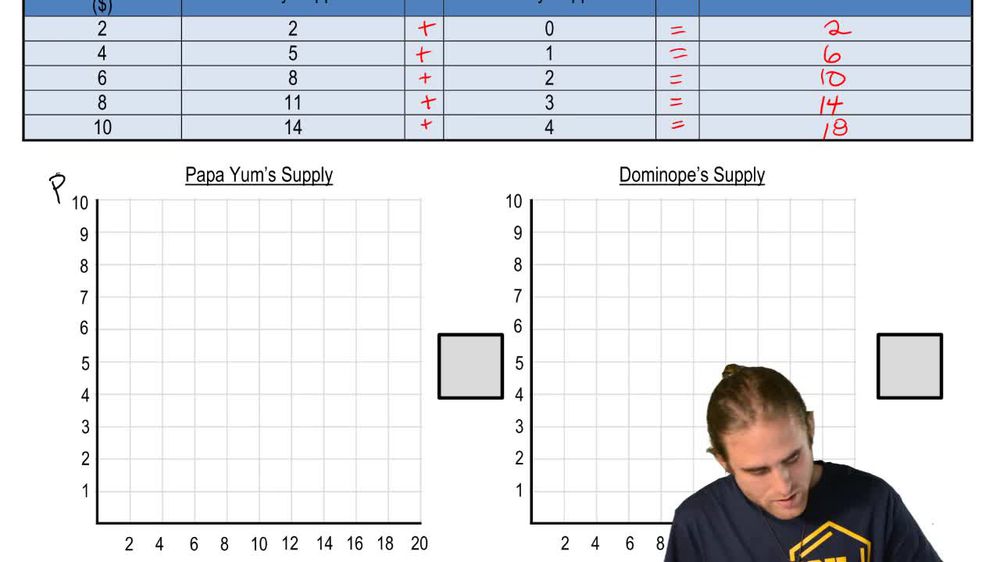
1/39
  • Why is the supply curve upward-sloping?

    The supply curve is upward-sloping because, according to the law of supply, as the price of a good increases, the quantity supplied also increases. This reflects a direct relationship between price and quantity supplied.
  • Why is the supply curve upward sloping?

    The supply curve is upward sloping because higher prices incentivize producers to supply more of a good, as they can earn greater revenue.
  • What factors can shift the supply curve for guitars?

    Factors such as changes in production costs, technology, number of sellers, or input prices can shift the supply curve for guitars.
  • What does the supply curve show?

    The supply curve shows the relationship between the price of a good and the quantity supplied, and it typically slopes upward.
  • Why does a supply curve slope upward?

    A supply curve slopes upward because as the price increases, producers are willing to supply more of the good.
  • How is a supply curve plotted?

    A supply curve is plotted with price on the vertical (y) axis and quantity supplied on the horizontal (x) axis.
  • What does a supply curve represent?

    A supply curve is a graphical representation showing the relationship between the price of a good and the quantity supplied.
  • Which statement best describes the relationship between price and quantity supplied?

    There is a direct relationship: as price increases, quantity supplied increases.
  • What is the market supply curve?

    The market supply curve is the sum of all individual suppliers' supply curves at each price level.
  • What is an example of the law of supply?

    If the price of wheat rises, farmers supply more wheat to the market.
  • What does a market supply curve show?

    A market supply curve shows the total quantity of a good that all suppliers in the market are willing to sell at various prices.
  • What term describes the amount of goods and services that producers will provide at various prices?

    Quantity supplied.
  • Which of these is the best description of a normal supply curve?

    A normal supply curve is upward-sloping, indicating that higher prices lead to higher quantities supplied.
  • What is supply?

    Supply is the behavior of sellers regarding the quantity of a good they are willing to produce and sell at different prices.
  • What do the points on a market supply curve represent?

    Each point represents the total quantity supplied by all sellers at a specific price.
  • What is true of the supply curve of a good?

    The supply curve of a good typically slopes upward, showing a direct relationship between price and quantity supplied.
  • When drawing a supply curve, what is labeled on the vertical axis?

    Price is labeled on the vertical (y) axis.
  • The upward slope of the supply curve reflects the

    The upward slope reflects the law of supply: higher prices lead to higher quantities supplied.
  • According to the law of supply, price and quantity supplied have a(n) ______ relationship.

    Direct (positive) relationship.
  • The supply curve is ______ sloping curve.

    Upward-sloping.
  • The supply curve is upward-sloping because:

    Producers are willing to supply more at higher prices due to increased potential profit.
  • The relationship between price and quantity supplied is typically

    Direct; as price increases, quantity supplied increases.
  • A firm's supply curve is upsloping because:

    As the price of the good rises, the firm is willing to supply more due to higher potential revenue.
  • For any competitive market, the supply curve is closely related to the

    The supply curve is closely related to the behavior of sellers and the law of supply.
  • The supply curve slopes upward because:

    Higher prices motivate producers to increase the quantity supplied.
  • What does the market supply curve indicate?

    The market supply curve indicates the total quantity of a good that all suppliers in the market are willing to sell at each possible price.
  • What is a supply schedule?

    A supply schedule is a table that shows the quantity of a good that suppliers are willing to sell at various prices.
  • Why is the market supply curve upward sloping?

    The market supply curve is upward sloping because as the price of a good increases, the quantity supplied by sellers also increases.
  • Why does the supply curve slope upward?

    The supply curve slopes upward because higher prices provide an incentive for sellers to supply more of the good.
  • Why is supply upward sloping?

    Supply is upward sloping because there is a direct relationship between price and quantity supplied; as price rises, suppliers are willing to produce and sell more.
  • Why do supply curves slope upward?

    Supply curves slope upward because an increase in price leads to an increase in the quantity supplied.
  • Why does the supply curve slope upward?

    The supply curve slopes upward due to the law of supply, which states that higher prices lead to higher quantities supplied.
  • Why is the supply curve upward sloping?

    The supply curve is upward sloping because suppliers are willing to offer more for sale as the price increases.
  • Why does a supply curve slope upward?

    A supply curve slopes upward because suppliers are more willing to produce and sell a good when its price increases.
  • What do the points on a market supply curve represent?

    Each point on a market supply curve represents the quantity of a good that all suppliers are willing to sell at a specific price.
  • Why is the supply curve upward sloping?

    The supply curve is upward sloping because as the price of a good increases, the quantity supplied increases, reflecting a direct relationship.
  • What is true about supply?

    Supply refers to the relationship between the price of a good and the quantity that sellers are willing to offer for sale.
  • What does a supply schedule show?

    A supply schedule shows the quantities of a good that suppliers are willing to sell at different prices.
  • What does a market supply curve show?

    A market supply curve shows the total quantity of a good that all suppliers in the market are willing to sell at each price.