Back

Quantitative Analysis of Consumer and Producer Surplus at Equilibrium definitions

Control buttons has been changed to "navigation" mode.
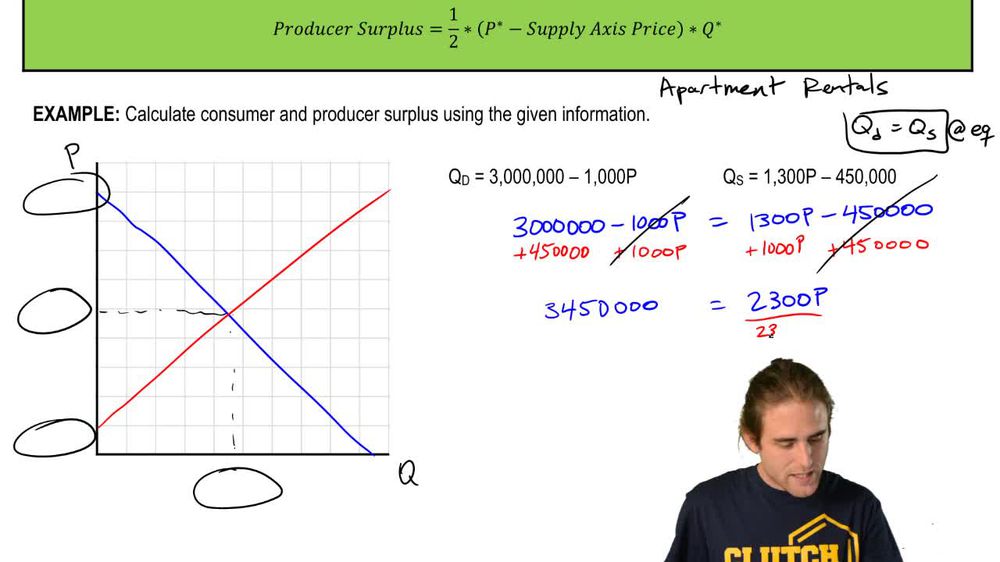
1/15
  • Equilibrium Price

    Market value where quantity demanded equals quantity supplied, found by solving demand and supply equations.
  • Equilibrium Quantity

    Amount exchanged at equilibrium price, calculated by substituting equilibrium price into either market equation.
  • Demand Curve

    Graphical representation showing how quantity demanded varies with price in a market.
  • Supply Curve

    Graphical representation showing how quantity supplied changes with price in a market.
  • Consumer Surplus

    Area above equilibrium price and below demand curve, representing extra benefit to buyers.
  • Producer Surplus

    Area below equilibrium price and above supply curve, representing extra benefit to sellers.
  • Access Price

    Value where either demand or supply curve intersects the price axis, used to calculate surplus areas.
  • Demand Access Price

    Highest price at which quantity demanded becomes zero, marking the demand curve's price axis intersection.
  • Supply Access Price

    Lowest price at which quantity supplied becomes zero, marking the supply curve's price axis intersection.
  • Triangle Area

    Mathematical formula used to compute surplus, based on base and height from market graph.
  • Algebraic Method

    Process of solving equations to find equilibrium values and calculate surplus quantitatively.
  • Graphical Representation

    Visual tool for illustrating market equilibrium and surplus areas using supply and demand curves.
  • Market Price

    Current value at which goods are exchanged, often corresponding to equilibrium price in analysis.
  • Quantity Demanded

    Amount buyers are willing to purchase at a specific price, described by the demand equation.
  • Quantity Supplied

    Amount sellers are willing to offer at a specific price, described by the supply equation.