Skip to main content
Microeconomics
My Course
Learn
Exam Prep
AI Tutor
Study Guides
Flashcards
Explore
Try the app
My Course
Learn
Exam Prep
AI Tutor
Study Guides
Flashcards
Explore
Try the app
Back
Price Elasticity of Demand on a Graph definitions
You can tap to flip the card.
Perfectly Elastic Demand
You can tap to flip the card.
👆
Perfectly Elastic Demand
A horizontal line on a graph, indicating infinite responsiveness; quantity demanded changes instantly with any price change.
Track progress
Control buttons has been changed to "navigation" mode.
1/15
Related flashcards
Related practice
Recommended videos
Price Elasticity of Demand on a Graph quiz #1
Price Elasticity of Demand on a Graph
18 Terms
Price Elasticity of Demand on a Graph
4. Elasticity
10 problems
Topic
Determinants of Price Elasticity of Demand
4. Elasticity
9 problems
Topic
4. Elasticity
11 topics
15 problems
Chapter
Guided course
11:34
Price Elasticity of Demand on a Graph
9
views
Terms in this set (15)
Hide definitions
Perfectly Elastic Demand
A horizontal line on a graph, indicating infinite responsiveness; quantity demanded changes instantly with any price change.
Perfectly Inelastic Demand
A vertical line on a graph, showing zero responsiveness; quantity demanded remains constant regardless of price.
Elastic Demand
A shallow curve where small price changes cause large shifts in quantity demanded, typical for goods with close substitutes.
Inelastic Demand
A steep curve where quantity demanded changes minimally despite significant price shifts, common for necessities.
Unit Elastic Demand
A curve where percentage changes in price and quantity demanded are equal, often seen in products like clothing.
Demand Curve
A graphical representation showing the relationship between price and quantity demanded, shaped by elasticity.
Price Elasticity
A measure of how much quantity demanded responds to price changes, ranging from zero to infinity.
Necessity
A product for which demand remains stable even with price increases, such as gasoline or life-saving drugs.
Substitute
An alternative product that consumers switch to when the price of another good rises, like chicken for beef.
Percentage Change
A proportional shift in price or quantity, used to compare responsiveness in elasticity calculations.
Competitive Market
A market where many sellers offer identical products, leading to perfectly elastic demand for individual suppliers.
Quantity Demanded
The amount of a product consumers are willing to purchase at a specific price, influenced by elasticity.
Horizontal Line
A graphical feature representing infinite elasticity, where price remains constant and quantity varies.
Vertical Line
A graphical feature representing zero elasticity, where quantity remains constant and price varies.
Steep Curve
A graph shape indicating low responsiveness; large price changes result in small quantity changes.
 BackBack
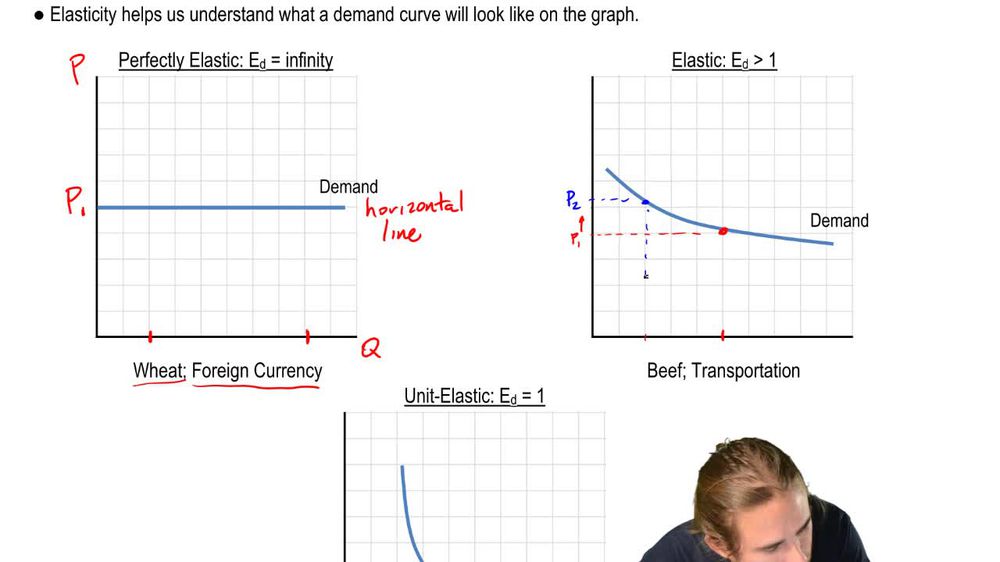
 11:34
11:34