Skip to main content
Microeconomics
My Course
Learn
Exam Prep
AI Tutor
Study Guides
Flashcards
Explore
Try the app
My Course
Learn
Exam Prep
AI Tutor
Study Guides
Flashcards
Explore
Try the app
Back
Monopoly Profit on the Graph definitions
You can tap to flip the card.
Monopoly
You can tap to flip the card.
👆
Monopoly
A market structure with a single seller, where the marginal revenue curve is distinct from the demand curve.
Track progress
Control buttons has been changed to "navigation" mode.
1/15
Related flashcards
Related practice
Recommended videos
Monopoly Profit on the Graph quiz #1
Monopoly Profit on the Graph
10 Terms
Monopoly Profit on the Graph
12. Monopoly
8 problems
Topic
Monopoly Efficiency and Deadweight Loss
12. Monopoly
8 problems
Topic
12. Monopoly
9 topics
13 problems
Chapter
Guided course
07:41
Monopoly Profit on the Graph
4
views
Terms in this set (15)
Hide definitions
Monopoly
A market structure with a single seller, where the marginal revenue curve is distinct from the demand curve.
Marginal Revenue
The additional income from selling one more unit, represented by a curve separate from the demand curve in monopoly.
Marginal Cost
The increase in total cost from producing one extra unit, used to determine optimal production quantity.
Profit Maximizing Quantity
The production level where the marginal revenue curve intersects the marginal cost curve on a graph.
Demand Curve
A graphical representation showing the price consumers are willing to pay at each quantity, used to determine price.
Average Total Cost
The per-unit cost of production, found on the ATC curve and used to calculate profit or loss.
Loss Minimizing Quantity
The output level where marginal revenue equals marginal cost, even if profit is negative.
Perfect Competition
A market structure where marginal revenue and price are identical, unlike monopoly.
Monopolistic Competition
A market structure similar to monopoly in profit calculation, but with multiple sellers.
Intersection Point
The spot on a graph where two curves cross, indicating optimal output for profit or loss.
Quantity Axis
The horizontal axis on a graph, used to identify the number of units produced.
Price
The value determined from the demand curve at the profit maximizing quantity.
Profit Area
The region on a graph where price exceeds average total cost, indicating positive earnings.
Loss Area
The region on a graph where average total cost is greater than price, indicating negative earnings.
Formula
A calculation method: (Price - Average Total Cost) x Quantity, used to determine profit or loss.
 BackBack
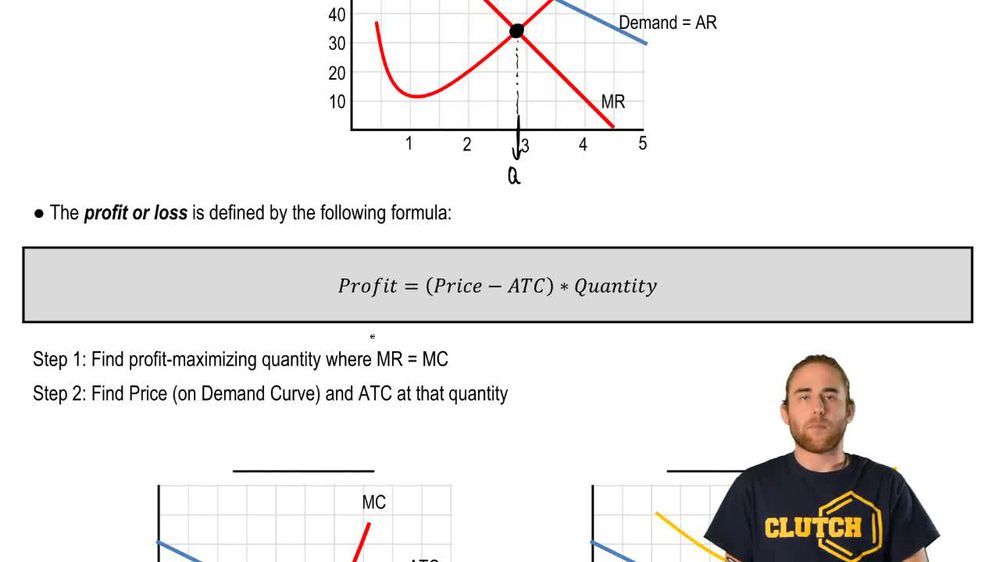
 07:41
07:41