Skip to main content
Microeconomics
My Course
Learn
Exam Prep
AI Tutor
Study Guides
Flashcards
Explore
Try the app
My Course
Learn
Exam Prep
AI Tutor
Study Guides
Flashcards
Explore
Try the app
Back
Marginal Cost definitions
You can tap to flip the card.
Marginal Cost
You can tap to flip the card.
👆
Marginal Cost
Represents the extra expense from producing one more unit, found by dividing the change in total cost by the change in output.
Track progress
Control buttons has been changed to "navigation" mode.
1/14
Related flashcards
Related practice
Recommended videos
Marginal Cost quiz #1
Marginal Cost
10 Terms
Marginal Cost
10. The Costs of Production
10 problems
Topic
The Relationship Between Average Cost and Marginal Cost
10. The Costs of Production
10 problems
Topic
10. The Costs of Production
9 topics
15 problems
Chapter
Guided course
10:48
Marginal Cost
9
views
Terms in this set (14)
Hide definitions
Marginal Cost
Represents the extra expense from producing one more unit, found by dividing the change in total cost by the change in output.
Total Cost
Sum of all expenses incurred in production, including both fixed and variable components.
Variable Cost
Expense that changes with the level of output, such as wages paid to workers.
Fixed Cost
Expense that remains constant regardless of output, like daily oven rental.
Quantity
Number of units produced, often measured as pizzas in the example.
Marginal Product
Increase in output resulting from adding one more worker, calculated as the change in quantity.
Marginal Cost Curve
Graphical representation showing how extra production costs change as output increases, typically forming a U shape.
Diminishing Returns
Phenomenon where adding more workers leads to smaller increases in output, causing extra costs to rise.
Wage
Payment to workers, treated as a variable cost in production calculations.
Output
Total amount produced, such as the number of pizzas made.
Inverse Relationship
Situation where one variable rises as another falls, seen between marginal product and extra production costs.
U-Shaped Curve
Pattern on a graph where costs decrease initially, then increase sharply, typical for extra production costs.
Change in Total Cost
Difference in overall expenses when output increases, often due to hiring additional workers.
Change in Quantity
Difference in the number of units produced when more resources are added.
 BackBack
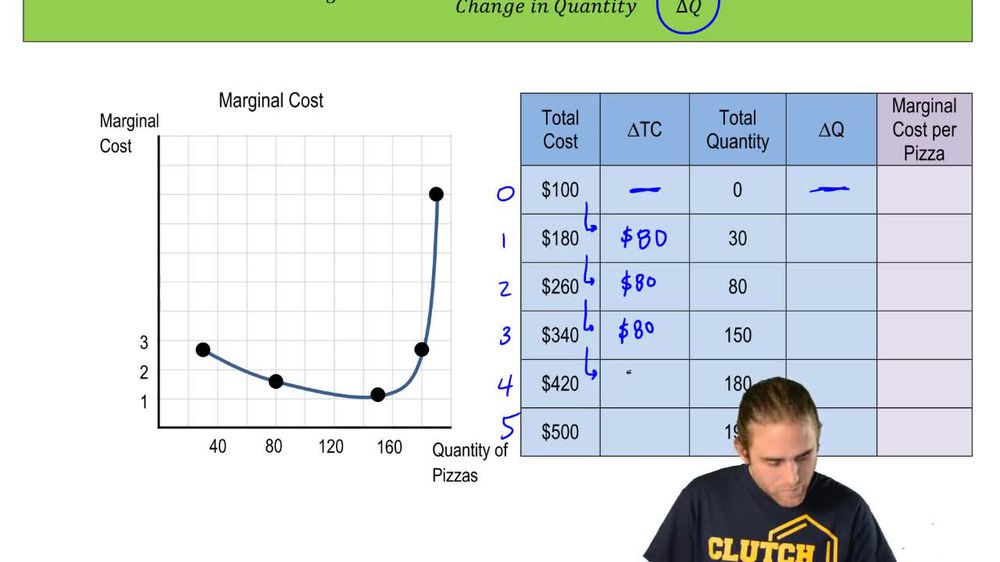
 10:48
10:48