Skip to main content
Microeconomics
My Course
Learn
Exam Prep
AI Tutor
Study Guides
Flashcards
Explore
Try the app
My Course
Learn
Exam Prep
AI Tutor
Study Guides
Flashcards
Explore
Try the app
Back
Graphing Costs definitions
You can tap to flip the card.
Marginal Cost
You can tap to flip the card.
👆
Marginal Cost
Amount added to total cost when producing one more unit; its curve gets steep quickly and intersects average cost curves at their minimum points.
Track progress
Control buttons has been changed to "navigation" mode.
1/15
Related flashcards
Related practice
Recommended videos
Graphing Costs quiz
Graphing Costs
15 Terms
Graphing Costs
10. The Costs of Production
10 problems
Topic
Average Total Cost: Short Run and Long Run
10. The Costs of Production
9 problems
Topic
10. The Costs of Production
9 topics
15 problems
Chapter
Guided course
10:54
Graphing Cost Curves
7
views
Terms in this set (15)
Hide definitions
Marginal Cost
Amount added to total cost when producing one more unit; its curve gets steep quickly and intersects average cost curves at their minimum points.
Average Fixed Cost
Portion of total cost that remains constant and is spread over increasing output, resulting in a curve that always decreases.
Average Variable Cost
Cost per unit that changes with output; its curve is U-shaped and lies below average total cost, narrowing the gap as output rises.
Average Total Cost
Sum of average fixed and variable costs per unit; its curve is U-shaped and always above average variable cost.
Cost Curve
Graphical representation showing how different types of costs change as output increases, including marginal, average, and fixed costs.
Output
Quantity of goods produced, which influences the behavior and shape of cost curves on a graph.
Minimum Point
Lowest value on a cost curve, where marginal cost intersects average variable and total cost curves.
Fixed Cost
Expense that does not change with production level and becomes less significant per unit as output increases.
Variable Cost
Expense that changes with the number of units produced, dominating total costs at high output levels.
U-Shaped Curve
Graph pattern where costs decrease, reach a minimum, then increase, seen in marginal, average variable, and average total cost curves.
Graph
Visual tool used to display relationships among cost curves and output, aiding in identifying cost behaviors.
Intersection
Point where marginal cost crosses average variable and total cost curves, indicating their minimum values.
Gap
Difference between average total cost and average variable cost curves, representing average fixed cost per unit.
Quantity
Number of units produced, affecting the shape and spacing of cost curves on a graph.
Total Cost
Combined expense of fixed and variable costs for all units produced, depicted by the average total cost curve.
 BackBack
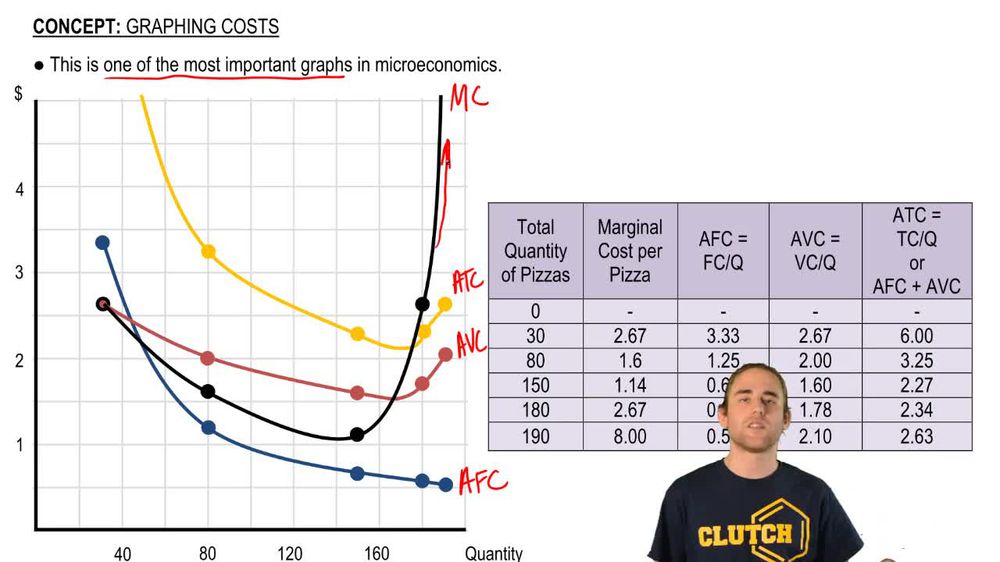
 10:54
10:54