Skip to main content
Microeconomics
My Course
Learn
Exam Prep
AI Tutor
Study Guides
Flashcards
Explore
Try the app
My Course
Learn
Exam Prep
AI Tutor
Study Guides
Flashcards
Explore
Try the app
Back
Cost-Minimizing Combination of Labor and Capital definitions
You can tap to flip the card.
Isoquant Curve
You can tap to flip the card.
👆
Isoquant Curve
Shows all input combinations yielding the same output; typically curved, representing production levels like 5,000 cookies.
Track progress
Control buttons has been changed to "navigation" mode.
1/15
Related flashcards
Related practice
Recommended videos
Cost-Minimizing Combination of Labor and Capital quiz #1
Cost-Minimizing Combination of Labor and Capital
13 Terms
Cost-Minimizing Combination of Labor and Capital
10. The Costs of Production
9 problems
Topic
Isocost Lines
10. The Costs of Production
8 problems
Topic
10. The Costs of Production
9 topics
15 problems
Chapter
Guided course
05:02
Cost Minimizing Combination of Labor and Capital
5
views
Guided course
01:45
Differences in Cost Minimizing Point
1
views
Terms in this set (15)
Hide definitions
Isoquant Curve
Shows all input combinations yielding the same output; typically curved, representing production levels like 5,000 cookies.
Isocost Line
Represents all input combinations with the same total cost; straight lines indicating different budgets for production.
Cost Minimizing Point
Occurs where an isoquant curve is tangent to an isocost line, indicating the least cost for a specific output.
Capital
Refers to physical assets like ovens used in production, with costs varying by country and affecting input choices.
Labor
Denotes human input such as bakers, with costs influencing the optimal mix of inputs for production.
Input Combination
Specific mix of labor and capital used to achieve a desired production level, such as 4 bakers and 2 ovens.
Production Level
Quantity of output targeted, like 5,000 cookies, determining which isoquant curve is relevant.
Budget
Total amount available for spending on inputs, represented by the position of isocost lines.
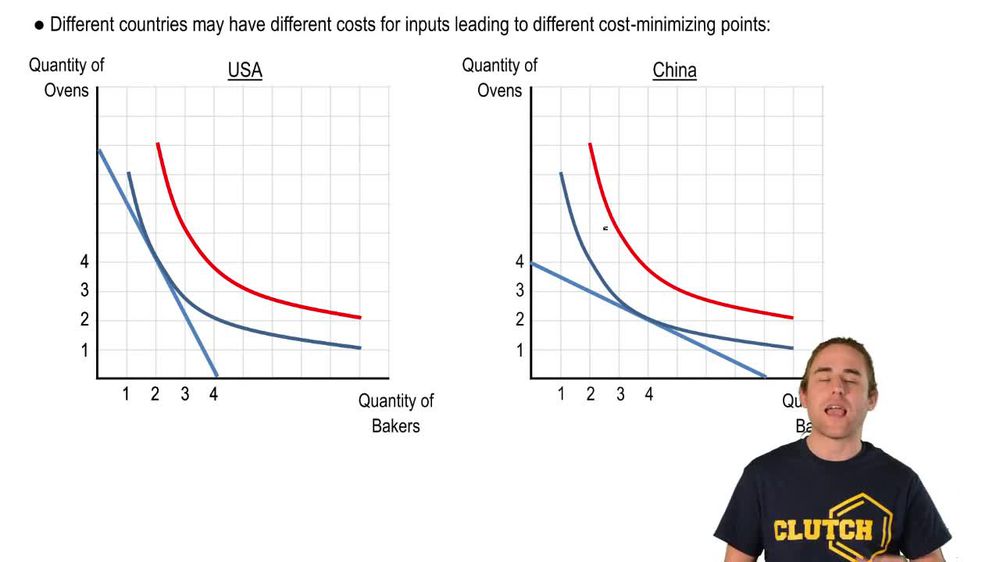
Comparative Advantage
Arises from differences in input costs across countries, leading to distinct cost minimizing points.
Total Cost
Sum spent on all inputs for a given production level, varying with input prices and chosen combinations.
Origin
Point on a graph where input quantities are zero; distance from it on isocost lines reflects higher budgets.
Tangent
Describes the point where an isoquant curve and an isocost line touch, indicating optimal input allocation.
Input Price
Cost associated with each unit of labor or capital, influencing the slope of isocost lines.
Output
Final product quantity resulting from chosen input combinations, such as cookies produced.
Profit Maximizing Point
Represents the production level where profits are highest, often guiding which isoquant curve to use.
 BackBack
 05:02
05:02