Skip to main content
Microeconomics
My Course
Learn
Exam Prep
AI Tutor
Study Guides
Flashcards
Explore
Try the app
My Course
Learn
Exam Prep
AI Tutor
Study Guides
Flashcards
Explore
Try the app
Back
AE Model: Graphing Macroeconomic Equilibrium definitions
You can tap to flip the card.
Aggregate Expenditures
You can tap to flip the card.
👆
Aggregate Expenditures
Total spending in an economy, including consumption, investment, government purchases, and net exports, used to determine equilibrium with real GDP.
Track progress
Control buttons has been changed to "navigation" mode.
1/15
Related flashcards
Recommended videos
AE Model: Graphing Macroeconomic Equilibrium quiz
AE Model: Graphing Macroeconomic Equilibrium
15 Terms
Guided course
13:28
Graphing Macroeconomic Equilibrium
1
views
Terms in this set (15)
Hide definitions
Aggregate Expenditures
Total spending in an economy, including consumption, investment, government purchases, and net exports, used to determine equilibrium with real GDP.
Macroeconomic Equilibrium
State where total spending equals total production, visually found at the intersection of the aggregate expenditures line and the 45-degree line.
Real GDP
Measure of production in the economy, represented on the x-axis of the aggregate expenditures model graph.
Consumption Function
Linear relationship showing how spending on goods and services changes with income, starting from a base level even with zero income.
Autonomous Consumption
Constant amount of spending that occurs regardless of income, forming the intercept of the consumption function.
Marginal Propensity to Consume
Fraction of additional income spent on consumption, represented as the slope of the consumption function line.
Investment
Constant spending by firms on capital goods, which shifts the aggregate expenditures line upward without altering its slope.
Government Purchases
Constant spending by the public sector, contributing to upward shifts in the aggregate expenditures line.
Net Exports
Difference between exports and imports, treated as a constant in the model and shifting the aggregate expenditures line upward.
45-Degree Line
Graphical line where spending equals production, used to visually identify macroeconomic equilibrium in the AE model.
Equilibrium GDP
Level of production where total spending matches output, found at the intersection of the aggregate expenditures and 45-degree lines.
Y-Intercept
Point where a function crosses the vertical axis, indicating base spending levels in the aggregate expenditures model.
Slope
Rate at which spending increases with income, determined by the marginal propensity to consume in the consumption function.
Disposable Income
Income available for spending after taxes, used in calculating consumption within the aggregate expenditures model.
Aggregate Expenditures Line
Graphical representation of total spending, built by adding constant components to the consumption function and shifting it upward.
 BackBack
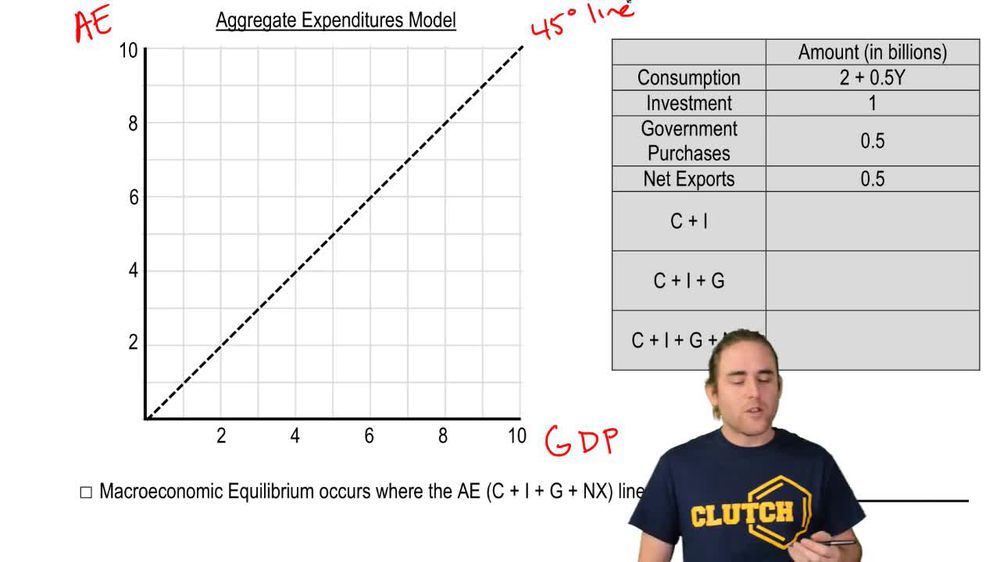
 13:28
13:28