Skip to main content
Macroeconomics
My Course
Learn
Exam Prep
AI Tutor
Study Guides
Flashcards
Explore
Try the app
My Course
Learn
Exam Prep
AI Tutor
Study Guides
Flashcards
Explore
Try the app
Back
Supply and Demand Together: One-sided Shifts definitions
You can tap to flip the card.
Equilibrium Price
You can tap to flip the card.
👆
Equilibrium Price
The market value where the quantity consumers want equals the quantity producers offer, found at the intersection of supply and demand curves.
Track progress
Control buttons has been changed to "navigation" mode.
1/15
Related flashcards
Related practice
Recommended videos
Supply and Demand Together: One-sided Shifts quiz
Supply and Demand Together: One-sided Shifts
15 Terms
Supply and Demand Together: One-sided Shifts
3. Supply and Demand
10 problems
Topic
Supply and Demand Together: Both Shift
3. Supply and Demand
10 problems
Topic
3. Supply and Demand - Part 1 of 2
11 topics
15 problems
Chapter
3. Supply and Demand - Part 2 of 2
1 topic
3 problems
Chapter
04:26
Demand Shifts
2
views
Guided course
03:36
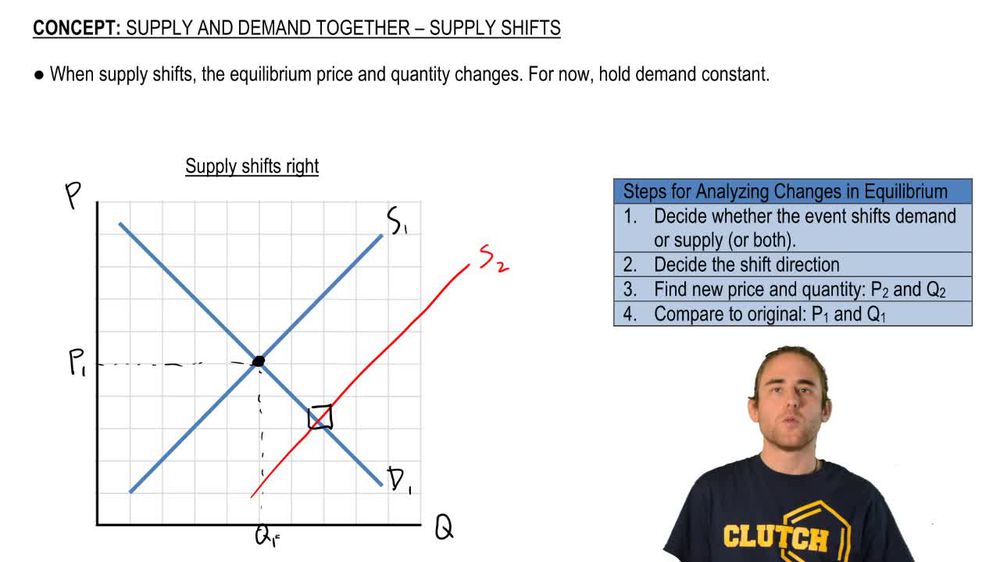
Supply Shifts
6
views
Terms in this set (15)
Hide definitions
Equilibrium Price
The market value where the quantity consumers want equals the quantity producers offer, found at the intersection of supply and demand curves.
Equilibrium Quantity
The amount exchanged in a market when supply and demand are balanced, located at the intersection point of both curves.
Demand Curve
A graphical representation showing the relationship between price and the quantity consumers are willing to buy.
Supply Curve
A graphical line illustrating how much producers are willing to offer at various prices.
Rightward Shift
A movement of a curve indicating an increase, such as more demand or greater supply at every price.
Leftward Shift
A movement of a curve indicating a decrease, such as less demand or reduced supply at every price.
Determinant
A factor that causes a curve to move, such as consumer preferences or input costs.
Input Cost
The expense of resources used in production, which can affect the position of the supply curve.
Technological Advancement
An improvement in production methods that enables more output at lower cost, shifting supply right.
Complementary Good
A product whose price change can influence the demand for another related product.
Graphical Analysis
The use of visual tools to track and compare changes in market outcomes after shifts in curves.
Intersection Point
The spot on a graph where supply and demand meet, indicating market balance.
Labeling
The practice of clearly marking axes, curves, and points to avoid confusion in graphical work.
Market Outcome
The resulting price and quantity after considering shifts in supply or demand.
Consumer Preference
A determinant reflecting changes in buyers’ tastes, which can shift the demand curve.
 BackBack
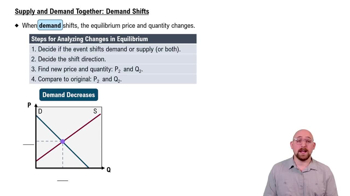
 04:26
04:26