Skip to main content
Macroeconomics
My Course
Learn
Exam Prep
AI Tutor
Study Guides
Flashcards
Explore
Try the app
My Course
Learn
Exam Prep
AI Tutor
Study Guides
Flashcards
Explore
Try the app
Back
Price Elasticity of Supply on a Graph definitions
You can tap to flip the card.
Supply Curve
You can tap to flip the card.
👆
Supply Curve
Graphical representation showing the relationship between price and quantity supplied, typically sloping upward.
Track progress
Control buttons has been changed to "navigation" mode.
1/14
Related flashcards
Related practice
Recommended videos
Price Elasticity of Supply on a Graph quiz
Price Elasticity of Supply on a Graph
15 Terms
Price Elasticity of Supply on a Graph
4. Elasticity
10 problems
Topic
Elasticity Summary
4. Elasticity
9 problems
Topic
4. Elasticity - Part 1 of 2
10 topics
15 problems
Chapter
4. Elasticity - Part 2 of 2
1 topic
3 problems
Chapter
Guided course
03:46
Price Elasticity of Supply on a Graph
10
views
Terms in this set (14)
Hide definitions
Supply Curve
Graphical representation showing the relationship between price and quantity supplied, typically sloping upward.
Elasticity
Measure of responsiveness of quantity supplied to changes in price, varying along different supply curves.
Perfectly Elastic Supply
Situation where any price change leads to infinite change in quantity supplied, depicted as a horizontal line.
Perfectly Inelastic Supply
Condition where quantity supplied remains unchanged regardless of price, shown as a vertical line.
Elastic Supply
Case where quantity supplied responds strongly to price changes, with the curve cutting the price axis.
Inelastic Supply
Scenario where quantity supplied responds weakly to price changes, with the curve cutting the quantity axis.
Unit Elastic Supply
Situation where percentage change in quantity supplied equals percentage change in price, with the curve passing through the origin.
Price Axis
Vertical axis on a graph representing different possible prices for a good or service.
Quantity Axis
Horizontal axis on a graph representing different possible quantities supplied.
Origin
Point where the price and quantity axes intersect, indicating zero price and zero quantity.
Upward Slope
Characteristic of supply curves indicating that higher prices are associated with higher quantities supplied.
Horizontal Line
Graphical feature representing perfect elasticity, where supply is infinitely responsive to price.
Vertical Line
Graphical feature representing perfect inelasticity, where supply does not change with price.
Axis Intersection
Location where a supply curve crosses either the price or quantity axis, indicating elasticity type.
 BackBack
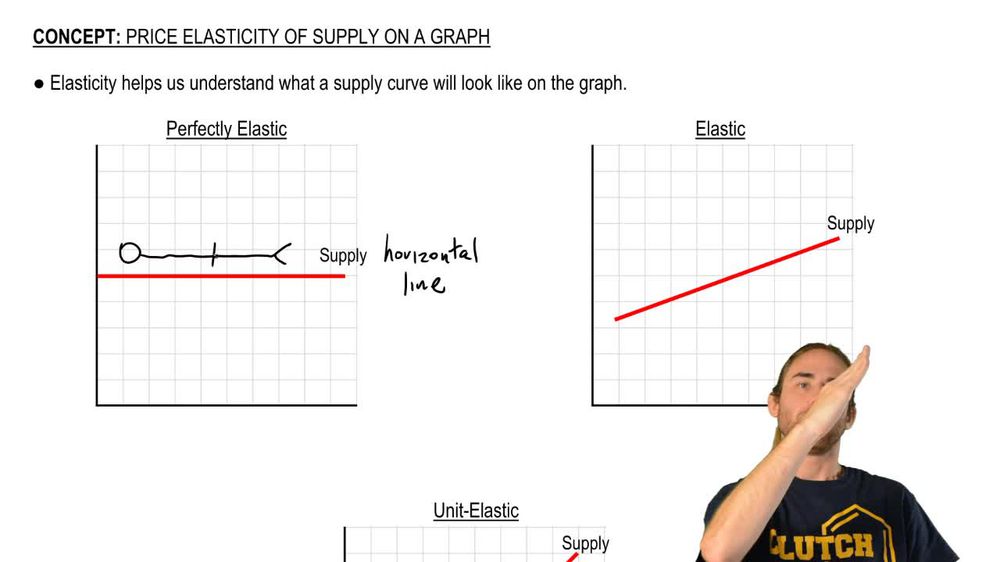
 03:46
03:46