Skip to main content
Macroeconomics
My Course
Learn
Exam Prep
AI Tutor
Study Guides
Flashcards
Explore
Try the app
My Course
Learn
Exam Prep
AI Tutor
Study Guides
Flashcards
Explore
Try the app
Back
Price Elasticity of Demand on a Graph definitions
You can tap to flip the card.
Perfectly Elastic Demand
You can tap to flip the card.
👆
Perfectly Elastic Demand
A horizontal line on a graph where any quantity is bought at one price, but none at any other price; seen in perfectly competitive markets.
Track progress
Control buttons has been changed to "navigation" mode.
1/15
Related flashcards
Related practice
Recommended videos
Price Elasticity of Demand on a Graph quiz
Price Elasticity of Demand on a Graph
15 Terms
Price Elasticity of Demand on a Graph
4. Elasticity
10 problems
Topic
Determinants of Price Elasticity of Demand
4. Elasticity
10 problems
Topic
4. Elasticity - Part 1 of 2
10 topics
15 problems
Chapter
4. Elasticity - Part 2 of 2
1 topic
3 problems
Chapter
Guided course
11:34
Price Elasticity of Demand on a Graph
9
views
Terms in this set (15)
Hide definitions
Perfectly Elastic Demand
A horizontal line on a graph where any quantity is bought at one price, but none at any other price; seen in perfectly competitive markets.
Perfectly Inelastic Demand
A vertical line on a graph where quantity demanded remains unchanged regardless of price; typical for essential goods.
Elastic Demand
A shallow demand curve where small price changes cause large shifts in quantity demanded; common for goods with substitutes.
Inelastic Demand
A steep demand curve where even large price changes result in minimal changes in quantity demanded; seen with necessities.
Unit Elastic Demand
A curve where percentage changes in price and quantity demanded are equal, often illustrated by proportional sales responses.
Demand Curve
A graphical representation showing the relationship between price and quantity demanded, varying in steepness based on elasticity.
Quantity Demanded
The amount of a good consumers are willing to buy at a specific price, responsive to price changes depending on elasticity.
Price Elasticity
A measure of how much quantity demanded responds to price changes, ranging from zero to infinity.
Perfect Competition
A market structure where identical products are sold and individual sellers have no power to set prices above the market rate.
Substitute Goods
Products that can replace each other in consumption, causing demand to shift when relative prices change.
Necessities
Goods for which demand remains stable even when prices rise, often resulting in inelastic demand curves.
Horizontal Line
A graphical feature indicating infinite elasticity, where price remains constant regardless of quantity.
Vertical Line
A graphical feature indicating zero elasticity, where quantity remains constant regardless of price.
Slope
The steepness of the demand curve, which visually indicates the degree of elasticity at different points.
Market Behavior
Patterns of consumer response to price changes, illustrated by the shape and position of the demand curve.
 BackBack
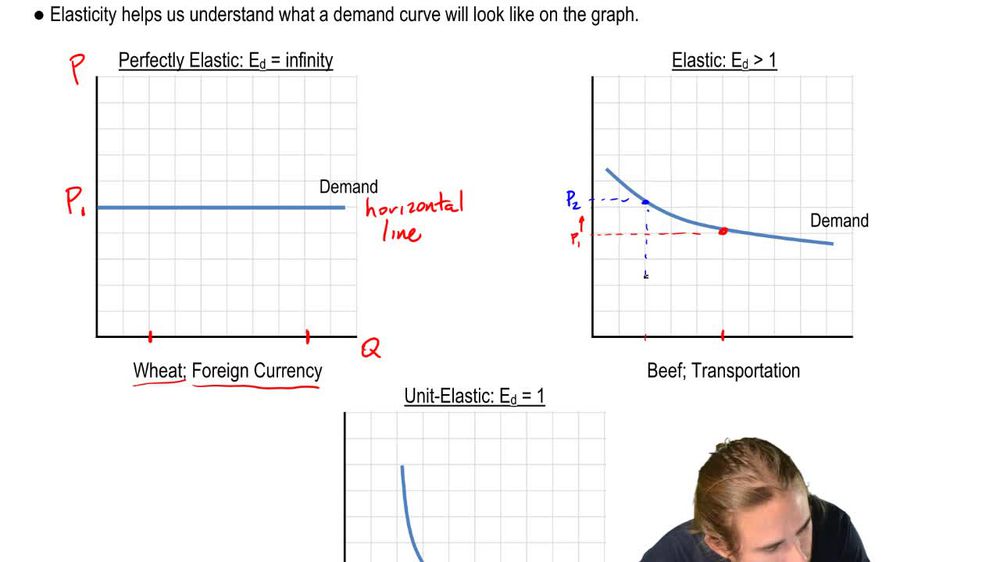
 11:34
11:34