What does an isoquant line represent in production analysis?
An isoquant line shows all combinations of two inputs, such as labor and capital, that produce the same level of output.
On an isoquant graph for cookie production, what do the axes typically represent?
The axes typically represent the quantity of ovens (capital) and the quantity of bakers (labor).
If a bakery uses more ovens, what generally happens to the number of bakers needed to produce the same output?
The number of bakers needed decreases as more ovens are used, illustrating the trade-off between inputs.
What is the marginal rate of technical substitution (MRTS)?
MRTS is the rate at which one input can be substituted for another while keeping output constant, calculated as the slope of the isoquant curve.
How do you calculate the MRTS between two input bundles?
MRTS is calculated as the change in one input divided by the change in the other input between two points on the isoquant.
What does a diminishing MRTS indicate about input substitution?
A diminishing MRTS indicates that as you substitute one input for another, each additional unit of the input becomes less effective at replacing the other.
Why are isoquant lines typically curved rather than straight?
Isoquant lines are curved because the rate of substitution between inputs changes due to diminishing marginal productivity.
What does it mean if two input bundles are on the same isoquant?
It means both bundles produce the same quantity of output using different combinations of inputs.
How can isoquant analysis help a firm optimize production costs?
Isoquant analysis helps firms find the most cost-efficient combination of inputs to produce a given output.
If a bakery moves from using 7 ovens and 1 baker to 4 ovens and 2 bakers, what is the MRTS?
The MRTS is 3, meaning 3 ovens can be replaced by 1 additional baker to maintain the same output.
What happens to the MRTS as you continue to substitute labor for capital?
The MRTS decreases, meaning you need to add more labor to replace each additional unit of capital.
What is the MRTS when moving from 4 ovens and 2 bakers to 2 ovens and 4 bakers?
The MRTS is 1, so for each oven removed, one more baker is needed to keep output constant.
What is the MRTS when moving from 2 ovens and 4 bakers to 1 oven and 9 bakers?
The MRTS is 1/5, meaning for each oven removed, five more bakers are needed to maintain output.
How are isoquant lines similar to indifference curves in consumer theory?
Both show combinations of two variables that yield the same result—isoquants for output, indifference curves for utility.
Why are higher isoquant lines located farther from the origin on a graph?
Higher isoquant lines represent higher levels of output, which require more inputs and thus are farther from the origin.
 Back
Back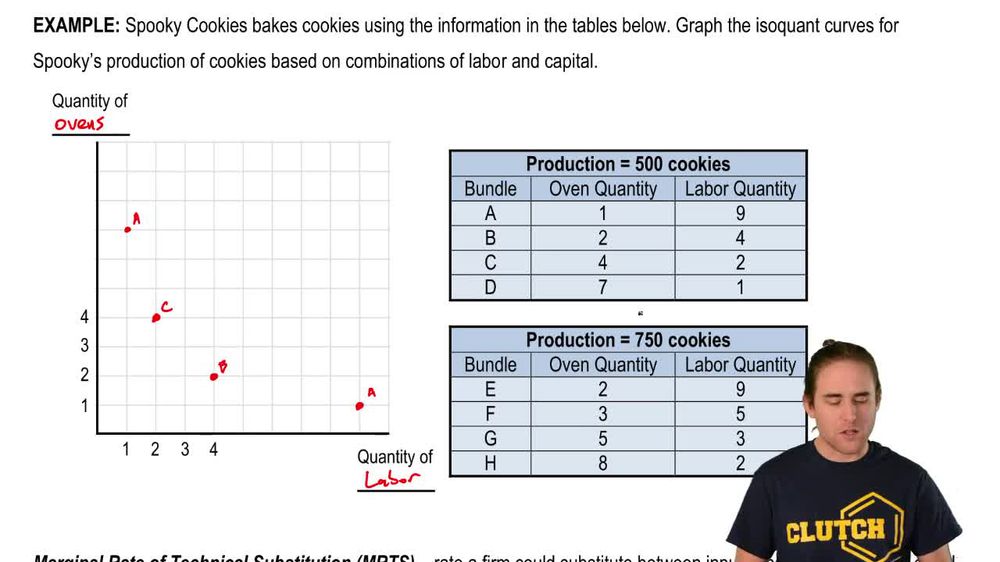
 09:45
09:45