Skip to main content
Macroeconomics
My Course
Learn
Exam Prep
AI Tutor
Study Guides
Flashcards
Explore
Try the app
My Course
Learn
Exam Prep
AI Tutor
Study Guides
Flashcards
Explore
Try the app
Back
Individual Supply Curve in the Short Run and Long Run definitions
You can tap to flip the card.
Short-Run Supply Curve
You can tap to flip the card.
👆
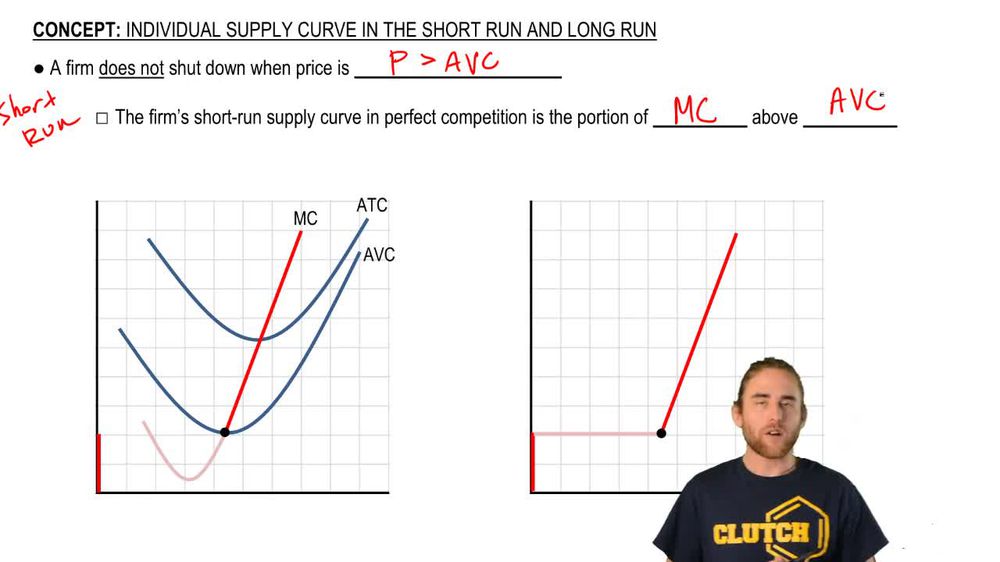
Short-Run Supply Curve
Portion of the marginal cost curve above minimum average variable cost, indicating output levels when price exceeds variable expenses.
Track progress
Control buttons has been changed to "navigation" mode.
1/15
Related flashcards
Recommended videos
Individual Supply Curve in the Short Run and Long Run quiz
Individual Supply Curve in the Short Run and Long Run
15 Terms
Guided course
03:12
Individual Firm Supply Curve in the Long Run
1
views
Guided course
03:19
Individual Firm Supply Curve in the Short Run
1
views
Terms in this set (15)
Hide definitions
Short-Run Supply Curve
Portion of the marginal cost curve above minimum average variable cost, indicating output levels when price exceeds variable expenses.
Long-Run Supply Curve
Segment of the marginal cost curve above minimum average total cost, representing output when price covers all production costs.
Marginal Cost Curve
Graph showing the additional cost of producing one more unit, crucial for determining supply decisions in both time frames.
Average Variable Cost
Per-unit measure of variable expenses, serving as the threshold for production decisions in the short run.
Average Total Cost
Per-unit measure of all production expenses, acting as the benchmark for long-run market participation.
Shutdown Point
Lowest price at which production covers variable expenses; below this, output drops to zero in the short run.
Exit Point
Lowest price at which all costs are covered; below this, firms leave the market in the long run.
Perfect Competition
Market structure where many firms sell identical products, leading to price-taking behavior and supply curves based on cost thresholds.
Profit
Difference between total revenue and total cost, positive only when price exceeds average total cost.
Quantity Supplied
Amount of output a firm offers at a given price, determined by where marginal revenue equals marginal cost.
Cost Curves
Graphs depicting relationships among various production expenses, essential for supply and shutdown decisions.
Marginal Revenue
Additional income from selling one more unit, equated with marginal cost to determine optimal output.
Production Decision
Choice to produce or not, based on whether price covers variable or total costs in different time frames.
Market Exit
Action taken when price fails to cover all costs in the long run, resulting in zero output.
U-Shaped Curve
Characteristic shape of cost curves, reflecting how costs per unit change with output and influencing supply thresholds.
 BackBack
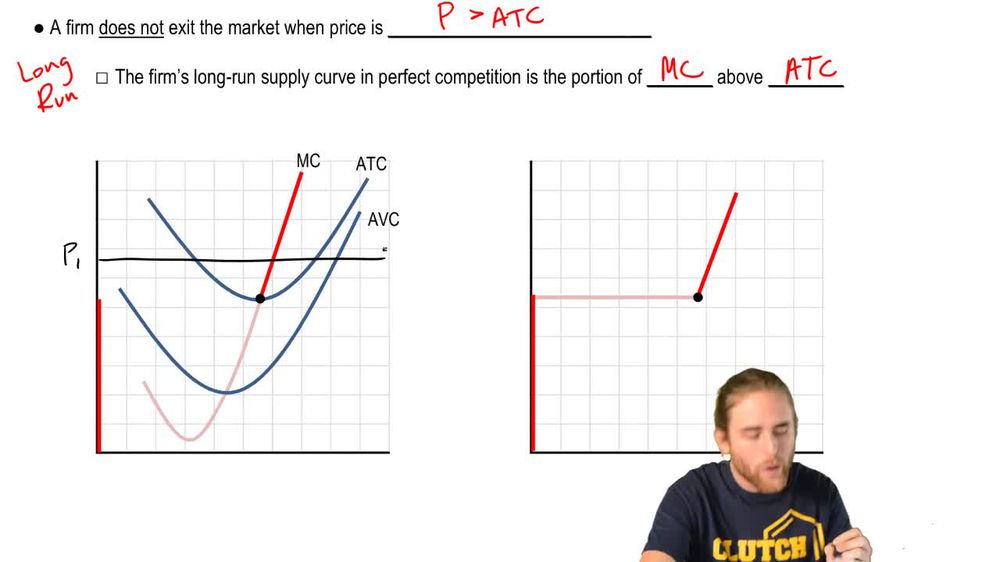
 03:12
03:12