Skip to main content
Macroeconomics
My Course
Learn
Exam Prep
AI Tutor
Study Guides
Flashcards
Explore
Try the app
My Course
Learn
Exam Prep
AI Tutor
Study Guides
Flashcards
Explore
Try the app
Back
Graphing Costs definitions
You can tap to flip the card.
Marginal Cost
You can tap to flip the card.
👆
Marginal Cost
The additional expense incurred from producing one more unit, depicted by a curve that intersects average cost curves at their lowest points.
Track progress
Control buttons has been changed to "navigation" mode.
1/14
Related flashcards
Recommended videos
Graphing Costs quiz
Graphing Costs
15 Terms
Guided course
10:54
Graphing Cost Curves
Terms in this set (14)
Hide definitions
Marginal Cost
The additional expense incurred from producing one more unit, depicted by a curve that intersects average cost curves at their lowest points.
Average Fixed Cost
A per-unit expense that continuously decreases as output rises, reflecting fixed expenses spread over more units.
Average Variable Cost
A per-unit expense that first falls then rises with output, forming a U-shaped curve, and never exceeds average total cost.
Average Total Cost
A per-unit expense combining fixed and variable components, always above average variable cost, and U-shaped on a graph.
Cost Curve
A graphical representation showing how different per-unit expenses change as output varies, crucial for analyzing production efficiency.
U-Shape
A graphical pattern where values decrease to a minimum and then increase, characteristic of several cost curves in production analysis.
Minimum Point
The lowest value on a curve, where marginal cost intersects average total and average variable cost curves.
Output
The quantity of goods produced, which influences the behavior and relationships among various cost curves.
Fixed Cost
An expense that remains unchanged regardless of production volume, causing average fixed cost to decline as output grows.
Variable Cost
An expense that changes with production volume, forming the basis for average variable cost calculations.
Gap
The vertical distance between average total cost and average variable cost curves, equal to average fixed cost at any output level.
Production Efficiency
A condition reflected by cost curves, indicating optimal resource use when costs are minimized at certain output levels.
Intersection
The point where two curves meet, notably where marginal cost crosses average total and average variable cost at their minimums.
Slope
The rate at which a curve rises or falls, indicating whether average costs are increasing or decreasing with output.
 BackBack
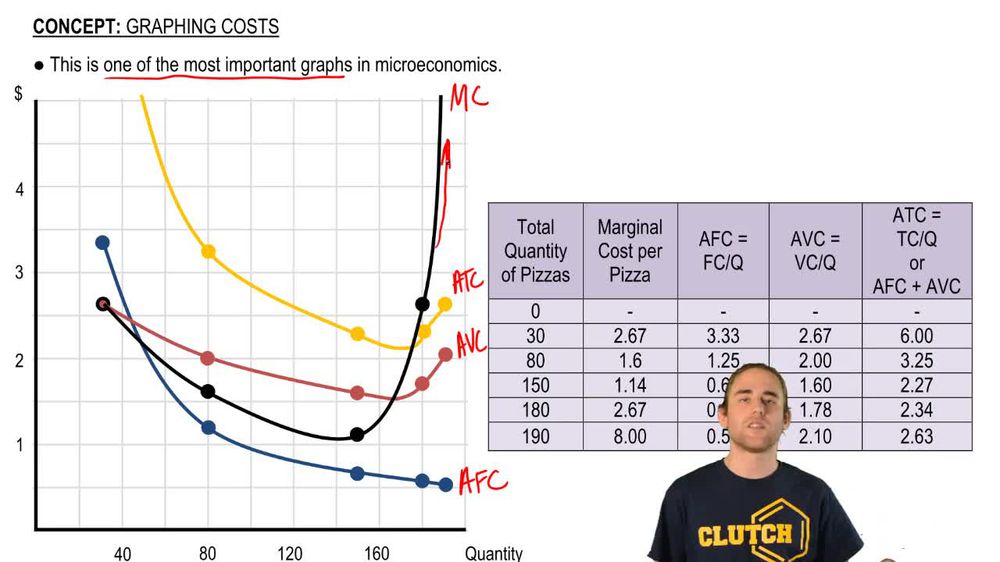
 10:54
10:54