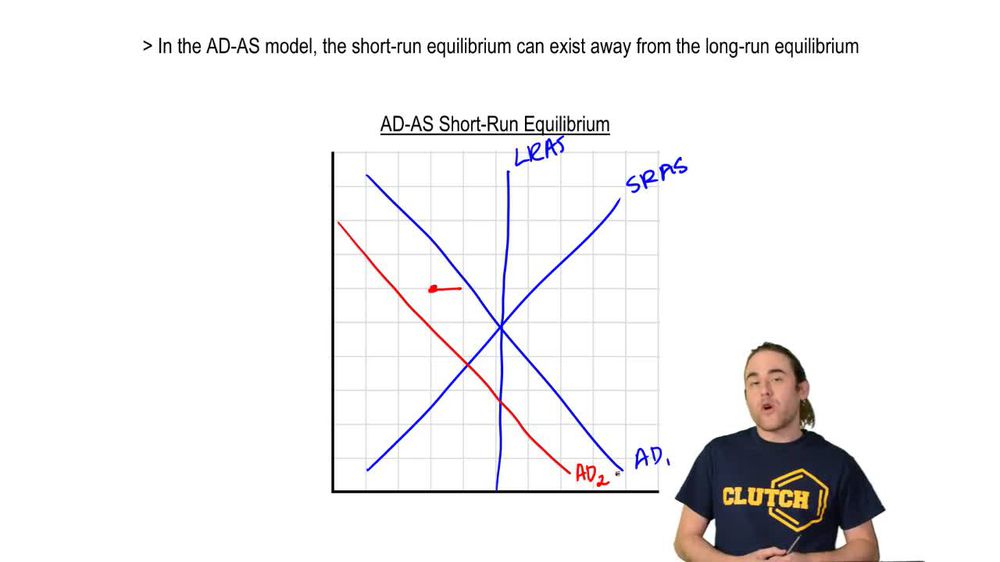
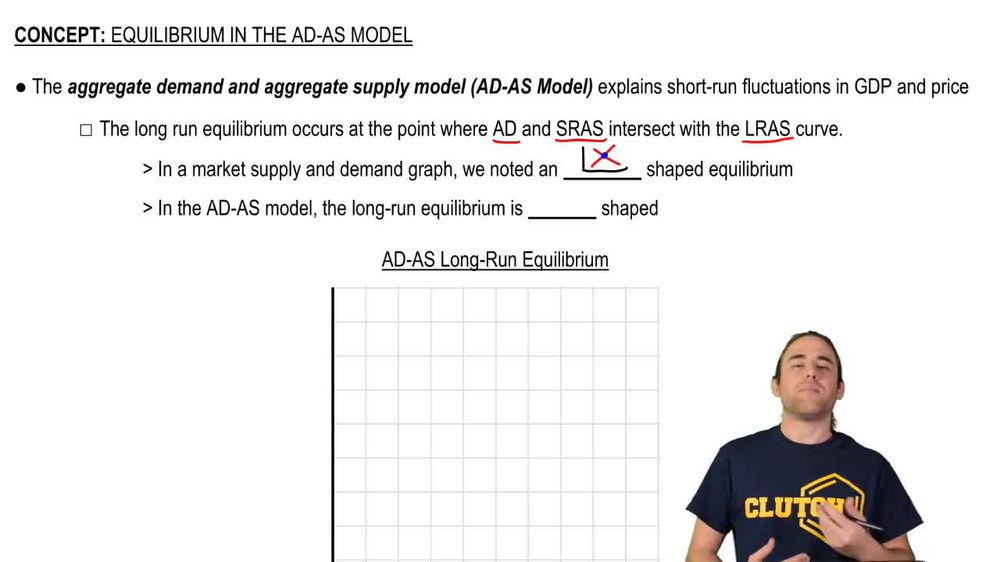
Back

AD-AS Model: Equilibrium in the Short Run and Long Run definitions

Control buttons has been changed to "navigation" mode.
1/14
  • Aggregate Demand

    A curve showing the total quantity of goods and services demanded across all levels of an economy at various price levels.
  • Short Run Aggregate Supply

    A curve representing the total output firms are willing to produce at different price levels in a period when some input prices are fixed.
  • Long Run Aggregate Supply

    A vertical curve indicating the economy's maximum sustainable output when all resources are fully utilized.
  • Equilibrium Price Level

    The price at which the quantity of goods and services demanded equals the quantity supplied in the economy.
  • Real GDP

    The total value of all final goods and services produced in an economy, adjusted for inflation.
  • Long Run Equilibrium

    A state where aggregate demand, short run aggregate supply, and long run aggregate supply intersect at a single point.
  • Short Run Equilibrium

    A point where aggregate demand and short run aggregate supply intersect, possibly away from long run aggregate supply.
  • Curve Shift

    A movement of an entire curve, such as aggregate demand or supply, due to changes in economic factors.
  • Price Level

    A measure reflecting the average of current prices across the entire spectrum of goods and services produced in the economy.
  • Intersection Point

    The spot on a graph where two or more curves cross, indicating equilibrium conditions.
  • Graph

    A visual representation used to illustrate relationships among aggregate demand, aggregate supply, and equilibrium.
  • X-Axis

    The horizontal line on a graph, typically representing real GDP or output in macroeconomic models.
  • Y-Axis

    The vertical line on a graph, usually indicating the price level in macroeconomic diagrams.
  • Star Shape

    A visual pattern formed on the AD-AS graph when all three curves intersect at a single equilibrium point.