Textbook Question
The following diagrams represent two similar reactions that have achieved equilibrium:
<IMAGE>
a. Write the expression for the equilibrium constant for each reaction.
3
views

 Verified step by step guidance
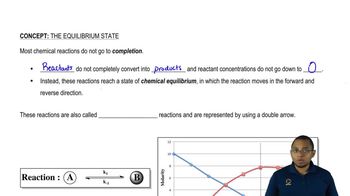
 03:42
03:42 02:50
02:50 09:34
09:34The following diagrams represent two similar reactions that have achieved equilibrium:
<IMAGE>
a. Write the expression for the equilibrium constant for each reaction.
Does entropy increase or decrease in the following processes?
a. Polymeric complex carbohydrates are metabolized by the body, converted into smaller simple sugars.
The following diagrams represent two similar reactions that have achieved equilibrium:
<IMAGE>
b. Calculate the value for the equilibrium constant for each reaction.
Do the following reactions favor reactants or products at equilibrium? Give relative concentrations at equilibrium.
a. Sucrose(aq) + H2O(l) ⇌ Glucose(aq) + Fructose(aq) K = 1.4 × 10⁵
Does entropy increase or decrease in the following processes?
c. 2 SO2(g) + O2(g) → 2 SO3(g)
Is the yield of SO3 at equilibrium favored by a higher or lower pressure? By a higher or lower temperature?
2 SO2(g) + O2 ⇌ 2 SO3(g) ∆H = -47 kcal/mol