Textbook Question
The following variances were calculated for two traits in a herd of hogs.
Calculate broad-sense (H²) and narrow-sense (h²) heritabilities for each trait in this herd.
 Verified step by step guidance
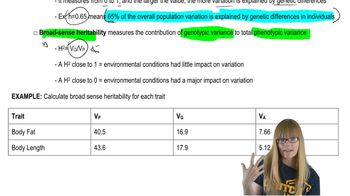
 07:04
07:04 08:34 07:04
The following variances were calculated for two traits in a herd of hogs.
Calculate broad-sense (H²) and narrow-sense (h²) heritabilities for each trait in this herd.
A hypothetical study investigated the vitamin A content and the cholesterol content of eggs from a large population of chickens. The following variances (V) were calculated.
Which trait, if either, is likely to respond to selection?
In a herd of dairy cows the narrow-sense heritability for milk protein content is 0.76, and for milk butterfat it is 0.82. The correlation coefficient between milk protein content and butterfat is 0.91. If the farmer selects for cows producing more butterfat in their milk, what will be the most likely effect on milk protein content in the next generation?
The following variances were calculated for two traits in a herd of hogs.
Which of the two traits will respond best to selection by a breeder? Why?
Corn plants from a test plot are measured, and the distribution of heights at 10-cm intervals is recorded in the following table:
Height (cm) Plants (no.)
100 20
110 60
120 90
130 130
140 180
150 120
160 70
170 50
180 40
Calculate
(a) the mean height,
(b) the variance,
(c) the standard deviation, and
(d) the standard error of the mean.
Plot a rough graph of plant height against frequency. Do the values represent a normal distribution? Based on your calculations, how would you assess the variation within this population?
A hypothetical study investigated the vitamin A content and the cholesterol content of eggs from a large population of chickens. The following variances (V) were calculated.
Calculate the narrow-sense heritability (h²) for both traits.