Textbook Question
Solve each system of equations. State whether it is an inconsistent system or has infinitely many solutions. If a system has infinitely many solutions, write the solution set with x arbitrary.
5x - 5y - 3 = 0
x - y - 12 = 0

 Verified step by step guidance
 06:07
06:07 03:56
03:56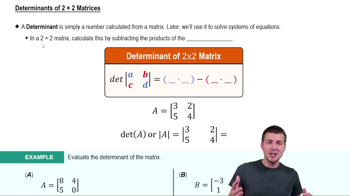 4:36
4:36Solve each system of equations. State whether it is an inconsistent system or has infinitely many solutions. If a system has infinitely many solutions, write the solution set with x arbitrary.
5x - 5y - 3 = 0
x - y - 12 = 0
Solve each nonlinear system of equations. Give all solutions, including those with nonreal complex components. See Examples 1–5.
Find each sum or difference, if possible.
Evaluate each determinant.
Find the partial fraction decomposition for each rational expression. See Examples 1–4. (-x4 - 8x2 + 3x - 10)/((x + 2)(x2 + 4)2)
Find the partial fraction decomposition for each rational expression. See Examples 1–4. (x2)/(x4 - 1)